
Executive Summary
- The Fed-ECB rate gap has inverted the conventional dollar-positive logic. With the federal funds rate at 3.64% and the ECB deposit facility rate at 2.00% as of May 2026 (per Federal Reserve and ECB data), the 164 basis-point differential still nominally favors the dollar — yet EUR/USD has rallied from a trough near 1.04 in early 2025 to approximately 1.1733, as markets price the trajectory, not the level, of rates.
- An ECB rate hike is now the base case for June 2026. A Bloomberg survey published April 2026 showed 86% market probability of a 25bp ECB hike on June 11, driven by eurozone headline inflation re-accelerating to 2.6% in March 2026 — its highest reading since July 2024 — against a backdrop of Middle East energy-price shocks compressing the ECB’s tolerance for further easing.
- Dollar softness is redirecting institutional capital into emerging markets at scale. Non-resident EM flows are projected to reach $935 billion in 2026 (per IIF data cited by T. Rowe Price’s Q1 2026 institutional note), with the BNY Institute’s Q1 2026 Global Investment Council report identifying central bank policy divergence as the single largest structural driver of cross-border capital movement in H1 2026.
- Stagflation risk in the US is the principal threat to this thesis. US CPI stands at 3.95% YoY and PCE at 3.77% as of the latest readings (per Bureau of Labor Statistics and Bureau of Economic Analysis), both materially above the Fed’s 2% target. If tariff-driven inflation prevents the two Fed cuts currently priced by futures markets — where roughly 77% odds are assigned to at least two 2026 cuts — the dollar decline arrests and EM inflow dynamics reverse sharply.
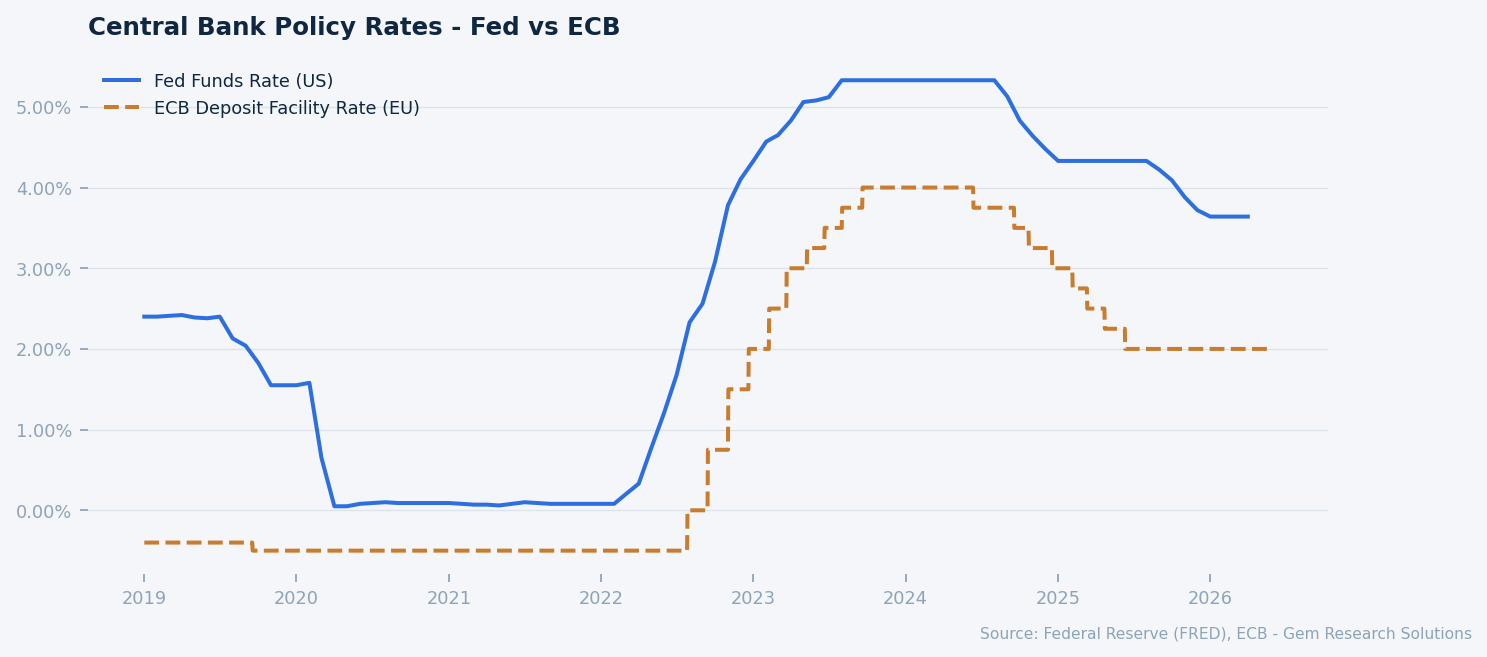
Fed Funds Rate vs ECB Deposit Facility Rate. Source: FRED, ECB.
Market Overview
The global rate cycle that defined 2022 through 2024 — synchronised tightening across the G10 — has fractured. What has emerged in its place is the most pronounced central bank policy divergence since the post-GFC recovery period of 2010–2012, when the ECB infamously hiked into a sovereign debt crisis while the Federal Reserve held near zero. This time the asymmetry runs in a different direction and carries distinct implications for currency markets, fixed income positioning, and cross-border capital allocation.
The Federal Reserve executed three rate cuts in the second half of 2025, bringing the federal funds rate to its current target range of 3.50–3.75%, or approximately 3.64% effective (per Federal Reserve data). The cuts were premised on a moderation in core inflation and cooling labour market conditions, though the disinflation has proven incomplete: PCE inflation at 3.77% YoY and headline CPI at 3.95% YoY, both per BLS and BEA data published through early 2026, leave the Fed’s stated 2% objective a considerable distance away. The dot plot published at the March 2026 FOMC meeting signalled two additional cuts in 2026, a view broadly corroborated by fed funds futures pricing as of late May 2026.
The European Central Bank moved on a faster and more decisive easing path from mid-2024 onward, reducing the deposit facility rate from 4.00% in June 2024 to the current 2.00% floor, reached by June 2025 (per ECB monetary policy decisions). Having front-loaded its easing, the ECB then paused — and is now facing a policy reversal of its own as eurozone inflation has re-accelerated. The ECB’s April 30, 2026 monetary policy decision held rates unchanged, but the language shifted meaningfully, and the June 11 meeting has become the focal event for global rates markets in Q2 2026.
Against this backdrop, risk assets have performed strongly. The S&P 500 stands at 7,520 as of late May 2026, representing a gain of 96.7% versus January 2023 (per FRED data), while the NASDAQ trades at 26,675. The VIX at 16.3 signals no immediate stress, though it remains within reach of the 20-level threshold that historically marks a shift in risk appetite. Credit spreads confirm the benign environment: US high-yield option-adjusted spreads stand at 271bps and investment-grade OAS at 74bps (per ICE BofA indices via FRED), both materially inside their respective period averages of approximately 330bps and 120bps. The constructive credit environment has amplified the signal from the rate divergence by reducing the carry cost of rotating into non-dollar assets.
The Narrowing Rate Differential and Currency Repricing
The mechanics of the Fed-ECB divergence trade are straightforward: when the Fed cuts and the ECB holds or hikes, the interest rate differential — which for much of 2023 and 2024 ran at 250bps or more in the dollar’s favour — compresses, reducing the carry incentive to hold dollar-denominated front-end assets and applying upward pressure on EUR/USD through both speculative positioning and fundamental revaluation.
The currency response has been material. EUR/USD bottomed near 1.04 in early 2025 at the peak of dollar bullishness, when markets anticipated prolonged Fed tightening alongside ECB cuts. As that narrative shifted through mid-2025, the pair rallied sharply, peaking at 1.2019 on January 27, 2026 — a level not seen since mid-2021. A partial correction brought the rate to 1.1435 on March 15, 2026, before it recovered to approximately 1.1733 as of late May 2026. Goldman Sachs estimates that every 50 basis points of Fed-ECB rate compression adds 300 to 400 pips to EUR/USD, a rule of thumb broadly consistent with the observed move. At the current differential of approximately 164bps, the Goldman model implies scope for further appreciation if the ECB follows the expected June hike with a second move and the Fed delivers its two projected cuts, compressing the gap toward 112bps by year-end.
The US Dollar Broad Nominal Index, which captures the dollar against a trade-weighted basket of major and emerging market currencies (per Federal Reserve H.10 data), stood at 119.3 as of May 2026. This remains elevated relative to the 2018–2019 baseline but reflects a meaningful retracement from the 2022 peak, consistent with the softening rate differential. Nomura and the Reuters currency strategist survey published in December 2025 placed 12-month consensus for EUR/USD at 1.17–1.20, a range that the current spot rate is already testing. The outlier bear case, maintained by Citi, projects a return to 1.10 premised on US growth re-acceleration and a more hawkish Fed — a scenario that requires either a significant upside surprise in US activity data or a material deterioration in eurozone growth prospects beyond the ECB’s current staff projection of just 0.9% for 2026.
J.P. Morgan Asset Management’s 2026 Liquidity Insights note identifies the divergence as the primary reshaper of front-end global liquidity positioning, noting that the recalibration of carry trades that had been structurally long dollars since 2022 represents a multi-trillion dollar repositioning with implications extending well beyond spot currency markets into short-dated fixed income, money market fund allocation, and cross-currency basis swap pricing.
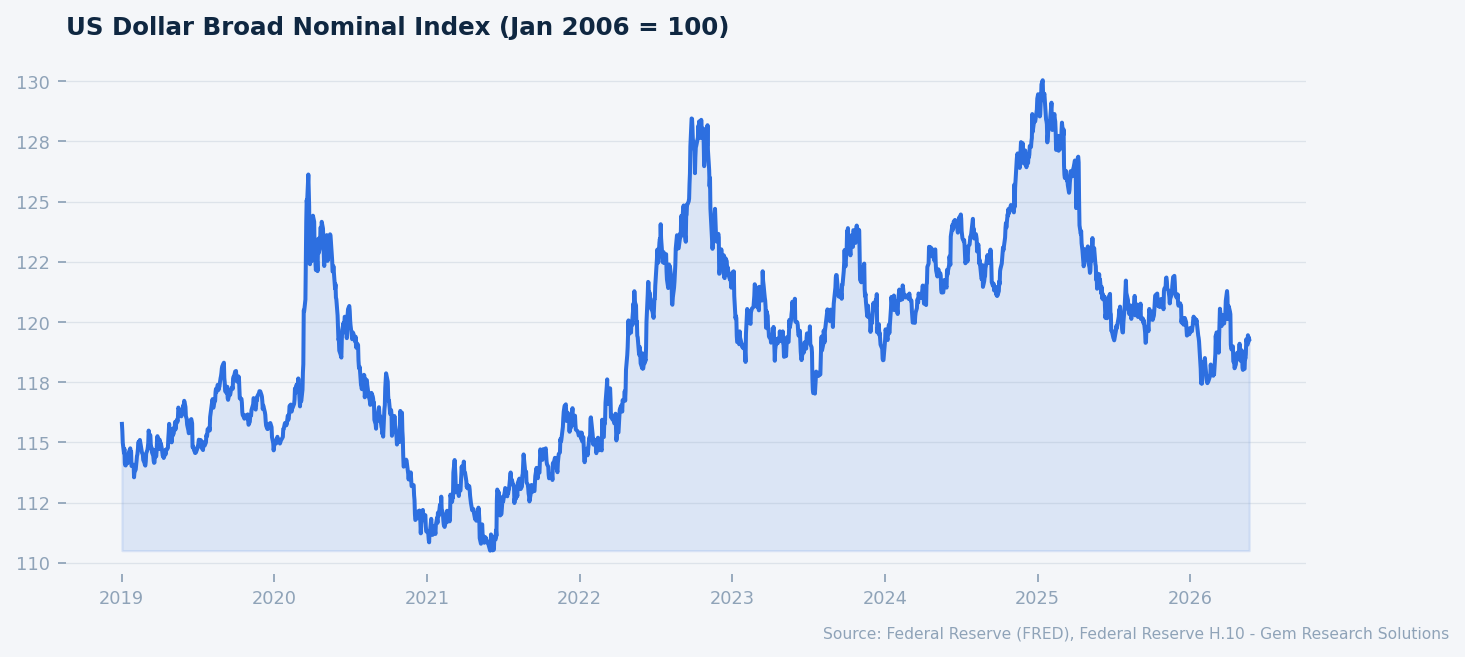
US Dollar Broad Nominal Index. Source: FRED, Federal Reserve H.10.
The ECB’s Reversal and the Inflation Re-Acceleration in the Eurozone
Perhaps the most consequential and underappreciated development in the Fed-ECB divergence narrative is not the direction the ECB has already traveled but the direction it is now likely to take. The ECB cut 200 basis points between June 2024 and June 2025 — faster and deeper than most analysts anticipated at the start of that cycle — and declared that the deposit facility rate at 2.00% was broadly consistent with the neutral rate estimated by ECB staff. What was not anticipated was the speed of eurozone inflation’s rebound.
Eurozone headline HICP inflation re-accelerated to 2.6% in March 2026, its highest reading since July 2024, driven primarily by energy prices linked to Middle East supply disruptions. Core inflation, while more contained, has remained sticky above the 2% target. The Bloomberg survey published in April 2026 showed 86% market probability of a 25bp ECB hike at the June 11, 2026 Governing Council meeting — a remarkable shift for an institution that had, as recently as late 2025, been expected to remain on hold through the year.
The ECB’s own economic blog published a February 2026 analysis noting that US tariffs paradoxically lower eurozone inflation in the near term by suppressing aggregate demand — a finding that complicates the tightening narrative and makes the June decision more contested internally than external market pricing implies. If tariffs do weigh on eurozone demand, the ECB faces a dilemma: hike to contain energy-driven headline inflation at the risk of further compressing growth from an already weak 0.9% projected trajectory, or hold and risk second-round effects from a labour market that has remained tighter than anticipated given subdued GDP growth. The April 30, 2026 ECB meeting held rates but the communication shift — notably the removal of language describing policy as “sufficiently restrictive” — telegraphed that the direction of the next move is upward.
For capital markets, the ECB’s reversal matters most through its interaction with the Fed path. A June ECB hike that is followed by a second move — which markets currently price with partial probability — would compress the Fed-ECB differential to roughly 87bps if the Fed simultaneously delivers two cuts, creating a fundamentally different environment for dollar positioning than that which has prevailed since 2022. The directional logic of the currency and capital flow trades described in this report would, in that scenario, be structurally reinforced rather than merely cyclically driven.
Emerging Market Capital Flows and the Dollar Rotation
The third and most globally significant consequence of Fed-ECB divergence is the capital flow rotation it is catalyzing toward emerging markets. The mechanism is well-established: dollar weakness reduces the currency risk of EM assets for unhedged investors, lowers the cost of dollar-denominated EM debt service, and compresses the relative yield advantage of US assets, prompting reallocation from US fixed income and equities toward higher-yielding EM instruments.
The scale in the current cycle is noteworthy. Non-resident EM capital flows are projected to reach $935 billion in 2026 per IIF data cited in T. Rowe Price’s Q1 2026 institutional note, which characterises emerging markets as being at an inflection point in the global capital cycle. The note explicitly links this inflection to dollar softness driven by Fed rate cuts and the narrowing Fed-ECB differential. The BNY Institute’s Q1 2026 Global Investment Council report designates this dynamic as the single largest structural driver of cross-border capital movement in H1 2026 — a designation that reflects both the magnitude of flows and the breadth of EM beneficiaries, spanning hard-currency sovereign bonds, local-currency fixed income, and EM equities.
The proportionality argument is compelling: a 1 percentage-point reallocation from US assets — which represent approximately 60% of global equity market capitalisation — into EM assets represents a proportionally much larger inflow relative to the size of EM asset pools. This amplification effect means that even modest shifts in US institutional allocation have the potential to materially re-price EM risk premiums. EM corporate high-yield OAS, which stood at 269bps as of late May 2026 (per ICE BofA data via FRED), has already tightened from wider levels seen in 2024, consistent with increased demand for EM credit from global allocators.
The IMF’s April 2026 Global Financial Stability Report flags geoeconomic fragmentation as a compounding risk to this flow dynamic. If trade bloc realignment accelerates — particularly as US tariff policy creates incentives for EM economies to deepen intra-bloc trade relationships with the EU or within ASEAN frameworks — the capital flow consequences of policy divergence could become structurally entrenched rather than cyclically reversible. The IMF specifically identifies sustained rate differentials in combination with fragmentation as creating financial stability risks that national macroprudential frameworks are not well-calibrated to address.
Risk Factors
US Stagflation Delay to Fed Cuts. The most immediate risk to the divergence thesis is that US inflation — CPI at 3.95% YoY and PCE at 3.77% YoY, both well above the 2% Fed target per BLS and BEA data — proves more durable than the Fed’s current base case assumes. Tariff pass-through into consumer prices has been partially offset by dollar strength and weak domestic demand, but the transmission mechanism remains active. If inflation does not decline meaningfully through Q3 2026, the Fed may be forced to pause its cutting cycle or, in a more severe scenario, signal a return to tightening. This would arrest the dollar decline, reverse EM carry attractiveness, and potentially re-price the entire divergence trade. The Citi 1.10 EUR/USD scenario is essentially a version of this outcome.
ECB Growth Constraint. The ECB’s projected eurozone growth of 0.9% for 2026 leaves virtually no buffer for policy error. A June hike that tips the eurozone into technical recession — particularly given the UK and continental European economies’ sensitivity to credit conditions — would force a rapid ECB reversal, potentially in Q3 or Q4 2026. Such a reversal would unwind the EUR/USD appreciation that underlies much of the current capital rotation logic. The ECB’s own acknowledgment of the demand-suppressing effect of US tariffs on the eurozone makes this scenario non-trivial.
Geopolitical Energy Price Shock Escalation. The March 2026 eurozone inflation re-acceleration to 2.6% was materially driven by Middle East energy-price shocks. A further escalation that pushes Brent crude above $100/bbl would simultaneously raise eurozone inflation (supporting further ECB hikes), raise US inflation (delaying Fed cuts), and potentially tip both economies toward stagflation — a scenario where rate differentials become less relevant than risk-off dollar demand, reversing the EM inflow dynamic abruptly.
Gem Research Perspective
Our base case holds that the Fed-ECB divergence is a durable structural feature of the 2026 macro landscape, not a transient positioning opportunity. The combination of a Fed that has already signaled two additional cuts, an ECB that is pivoting back toward tightening against a backdrop of re-accelerating inflation, and a dollar that remains elevated by historical trade-weighted standards creates a credible multi-quarter framework for continued EUR/USD appreciation toward the 1.18–1.20 range and sustained EM capital inflows.
The critical variable to monitor is not the June ECB decision itself — which at 86% market probability is largely discounted — but the communication accompanying it. An ECB that signals a conditional second hike contingent on inflation data would represent a material hawkish surprise relative to current consensus and could accelerate the USD decline more rapidly than our base case assumes. Conversely, language that frames June as a “one and done” adjustment would likely cap EUR/USD near current levels through Q3.
On the US side, the PCE print for May 2026 (due mid-June) will be the decisive data point for Fed cut timing. A reading at or below 3.5% would reinforce the two-cut path; a reading above 4.0% would materially raise the probability of the stagflation-delay scenario described in the risk section. Investors with cross-border fixed income and EM exposure should treat that release as the primary risk management event of the near-term calendar. We maintain a constructive view on local-currency EM debt and a moderately negative view on broad dollar indices through year-end 2026, with the caveats noted above.