
Executive Summary
- Capex commitments have reached an historically unprecedented scale. The five largest hyperscalers — Amazon, Alphabet, Microsoft, Meta, and Oracle — are on track to deploy approximately $725 billion in capital expenditure in 2026, a 77% year-on-year increase from roughly $410 billion in 2025. An estimated 75% of that total, or approximately $450 billion, is AI-specific: GPU clusters, purpose-built data centres, and high-bandwidth networking. Capital intensity at some operators has reached 45–57% of revenue, a level with no modern precedent in the technology sector.
- Nvidia’s order book functions as the clearest demand signal. The company’s data centre segment generated $62.3 billion in Q4 FY2026, up 75% year-on-year, and management has characterised forward visibility as exceeding $1 trillion in confirmed AI chip orders through 2027. Blackwell systems were fully booked through mid-2026; H100 GPU rental prices rose 20% in the first half of 2026, an inversion of normal hardware depreciation dynamics that reflects sustained supply constraint.
- The DeepSeek episode reframed — but did not resolve — the efficiency debate. The January 2025 disclosure that a competitive reasoning model was trained for under $6 million triggered approximately $1 trillion in single-session equity losses across US and European technology stocks and erased nearly $600 billion in Nvidia’s market capitalisation. Hyperscalers did not revise spending plans downward; most analysts invoked Jevons’s Paradox, arguing that lower inference costs expand total compute demand. The debate has since shifted from whether spending will continue to what returns it will generate.
- Monetisation lag is the central structural risk. Goldman Sachs and Morgan Stanley have both published ROI-sceptic frameworks. Forrester projects that 25% of planned enterprise AI spending will slip to 2027 as firms fail to demonstrate returns. Amazon is projected to turn free-cash-flow negative in 2026. The critical question is whether enterprise AI adoption — which drives inference revenue — can close an estimated 18–24 month lag relative to the build-out before utilisation rates create a cyclical air pocket in hyperscaler economics.
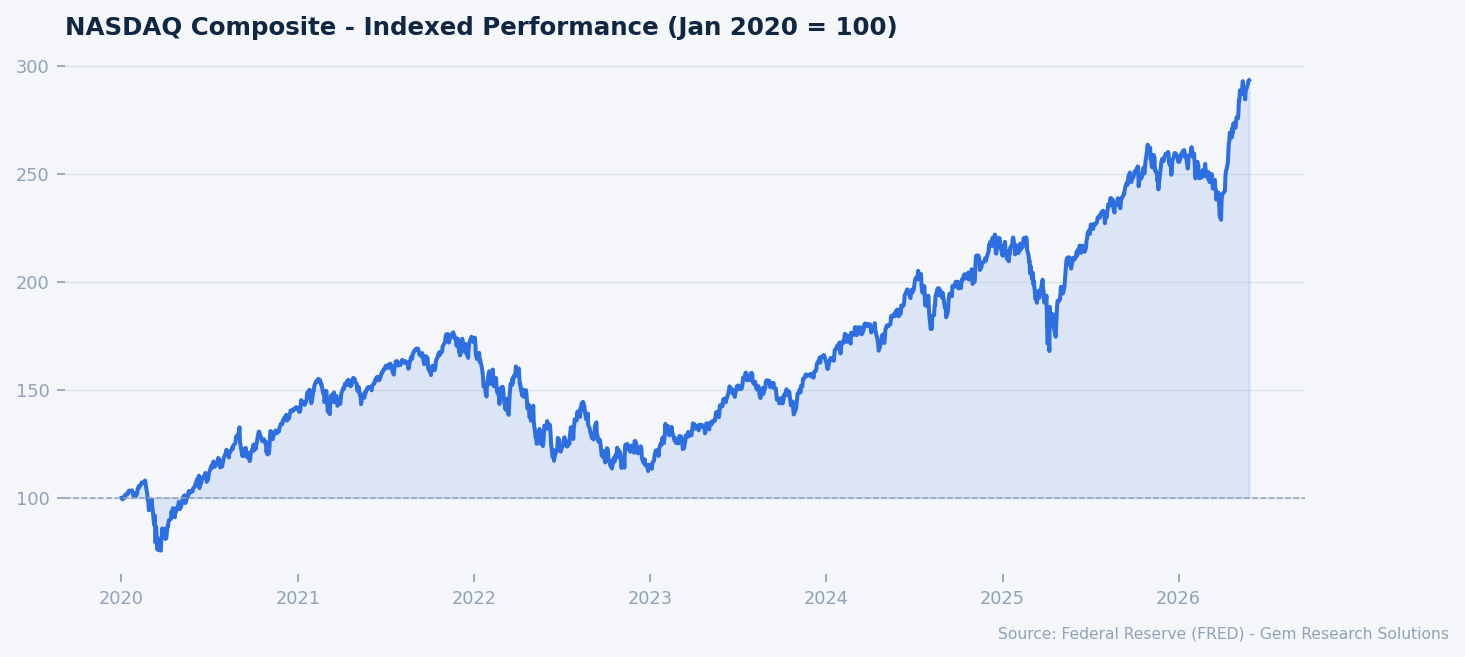
NASDAQ Composite indexed to Jan 2020 = 100. Source: FRED.
Market Overview
The AI infrastructure investment cycle now ranks among the largest single-purpose capital mobilisations in modern corporate history. To contextualise the scale: the NASDAQ Composite, as tracked by FRED data, stood at approximately 26,675 as of May 2026, implying a gain of roughly 97% since January 2023 as markets priced in an AI-driven technology earnings supercycle. Private nonresidential fixed investment in the United States reached $3.8 trillion at a seasonally adjusted annual rate as of the latest BEA release, and AI-related data-centre and compute infrastructure now constitutes a measurable and growing share of that aggregate figure.
The macro backdrop provides a supportive, if imperfect, foundation for continued spending. The Federal Reserve’s benchmark rate stood at 3.64% as of May 2026, per Federal Reserve H.15 data, down from the 5.25–5.50% peak cycle, reducing the cost of capital for long-duration infrastructure projects. Investment-grade credit spreads stood at 74 basis points over Treasuries — well inside the long-run period average of approximately 120 basis points, per ICE BofA index data published via FRED — meaning large-cap technology issuers face historically favourable financing conditions. The 10-year Treasury yield of 4.48% implies real borrowing costs that remain elevated relative to the 2010s but are manageable for firms generating the kind of operating cash flows that the leading hyperscalers produced through 2025.
At the same time, the macroeconomic environment is not uniformly accommodating. CPI headline inflation stood at 3.95% year-on-year and core PCE at 3.77% as of April 2026, per Bureau of Labor Statistics and Bureau of Economic Analysis data respectively — both above the Federal Reserve’s 2% target. Manufacturing capacity utilisation of 75.7% is marginally below the long-run average of 76.0%, per Federal Reserve G.17 data, a signal that broad industrial demand has not accelerated in step with the AI segment’s procurement requirements. These conditions create a bifurcated demand picture: AI-related capital goods are supply-constrained while the broader industrial base remains sub-trend.
Against this backdrop, the central analytical question is not whether the AI build-out is real — the capex commitments are legally disclosed and operationally underway — but whether the anticipated revenue trajectory justifies current investment levels and valuations, and at what point the cycle transitions from secular to cyclical dynamics.
Hyperscaler Capex: The Anatomy of a $725 Billion Commitment
The composition and distribution of hyperscaler capex in 2026 warrants close examination, because the aggregate figure obscures meaningful differences in strategic rationale across operators. Amazon leads with approximately $200 billion in total capex, a figure that encompasses both AWS AI infrastructure and physical logistics, though management has explicitly ring-fenced AI compute as the primary growth driver. Alphabet has guided to $175–190 billion, representing the most aggressive capital intensity expansion relative to its recent historical baseline. Meta’s range of $115–135 billion is notable given the company’s explicit ambition to achieve artificial general intelligence, a stated objective that implies open-ended compute scaling. Microsoft’s commitment of approximately $120 billion reflects both Azure cloud capacity and the deep integration of OpenAI infrastructure. Oracle adds a further $50 billion, with its cloud infrastructure business now functioning as an overflow capacity provider for hyperscalers constrained by their own build timelines.
The capital intensity ratios — capex as a share of revenue reaching 45–57% at some operators — represent a structural departure from the technology sector’s historical profile. For comparison, semiconductor manufacturers operating capital-intensive fabs have typically operated at 20–30% capital intensity. The current AI infrastructure cohort has, in effect, adopted the capital structure of a utility while retaining the valuation premium of a software platform. This compression of business model categories is at the heart of the analytical tension between bulls and bears.
Wall Street consensus, as surveyed by Morgan Stanley in its 2026 AI Market Trends publication, now anticipates capex growth moderating from approximately 54% in 2025 to 19% in 2026, implying that the steepest phase of the ramp may already be in the rear-view mirror. The moderation, however, is in growth rates rather than absolute levels: $725 billion at 19% growth still represents an enormous incremental capital deployment. The relevant question for capital market participants is whether the revenue step-up that management teams implicitly assume in their spending plans — typically a 3-to-5-year payback horizon — will materialise on schedule or whether utilisation rates will disappoint in the nearer term.
Free cash flow trajectories provide the most direct stress test. Amazon is projected to move to a free-cash-flow negative position in 2026, a development that would, in any other historical technology context, trigger a significant equity de-rating. That it has not done so speaks to the degree to which markets are discounting future AI revenue streams at an unusually long horizon — a valuation posture that creates asymmetric downside risk if adoption timelines slip.
The Nvidia Demand Signal and the Hardware Supply Constraint
No single data point more cleanly captures the structural nature of AI infrastructure demand than Nvidia’s reported order backlog. Management characterised forward demand visibility as exceeding $1 trillion in confirmed chip orders through 2027 — a figure that, if accurate, represents a level of revenue visibility that would be exceptional in any sector but is genuinely without precedent in the semiconductor industry. The data centre segment generated $62.3 billion in Q4 FY2026 alone, a 75% year-on-year increase that sustained the growth trajectory established over the prior eight quarters.
The secondary market for GPU compute provides a corroborating signal that is arguably more objective than management guidance. H100 GPU rental prices rose 20% in the first half of 2026; even legacy A100 units — hardware that would normally be depreciating toward commodity pricing — appreciated 15% over the same period, per market data reported by 247 Wall St. This inversion of the typical hardware depreciation curve is a reliable indicator of demand pressure outpacing production capacity at the leading edge. The Semiconductor IP Index, which stood at 178.2 as of the latest available reading versus approximately 105 in 2019, per FRED data, confirms that the broader IP licensing ecosystem has repriced to reflect sustained demand expectations.
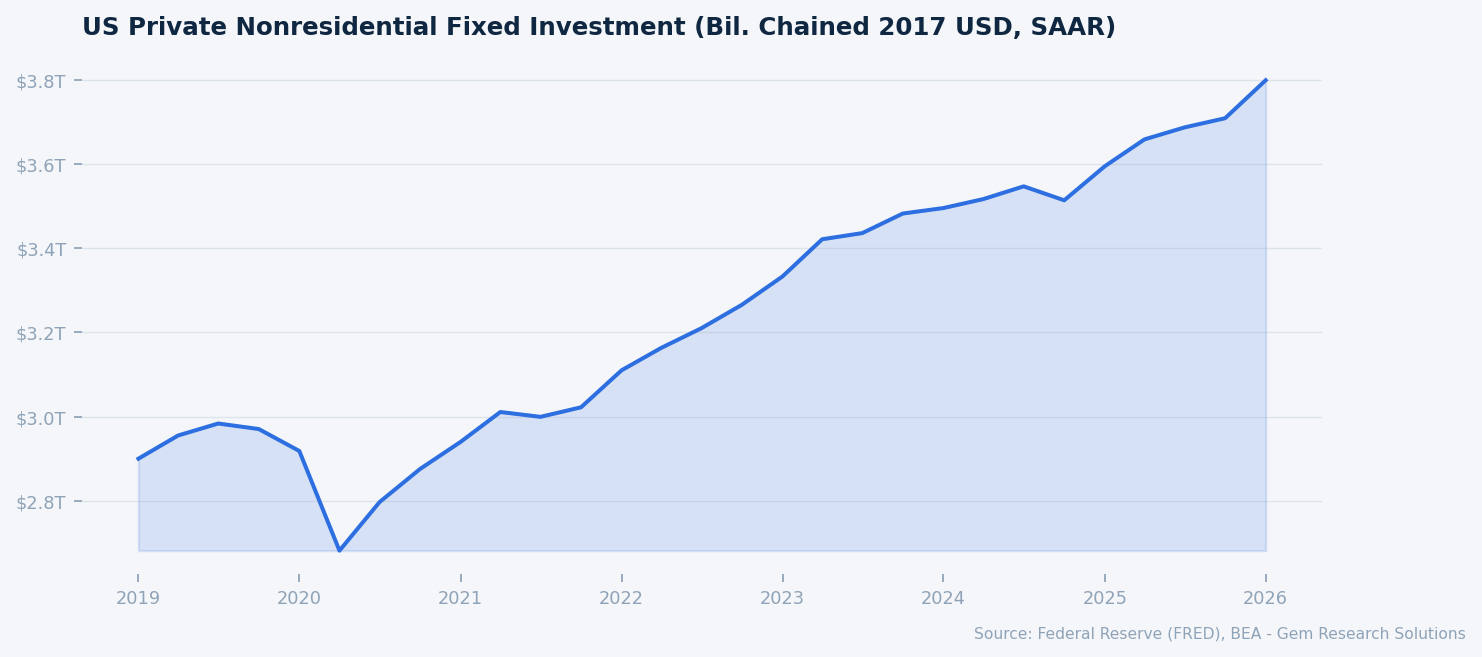
US private nonresidential fixed investment ($T, SAAR). Source: FRED, BEA.
Blackwell GPU systems were fully booked through mid-2026, and the supply constraint extends beyond chips to the broader stack: high-bandwidth memory, custom networking ASICs, power delivery infrastructure, and cooling systems are all experiencing lead-time extensions. The IEEFA flagged in early 2025 that projected data-centre electricity demand from just three US markets exceeded credible nationwide supply forecasts — a supply-side constraint that is physical rather than financial and therefore not readily resolved by price adjustment alone. This creates a durable scarcity premium for well-positioned operators with secured power agreements and existing facility capacity, a dynamic that KKR and BlackRock have both identified in published frameworks as generating long-cycle pricing power distinct from typical technology hardware commoditisation patterns.
The risk embedded in the supply-constraint thesis is that it assumes demand persistence. If model efficiency gains — the mechanism highlighted by the DeepSeek episode — reduce per-task compute requirements faster than utilisation expands, the supply scarcity premium erodes. This is not a tail risk; it is the central analytical tension in the sector.
The DeepSeek Inflection: Jevons’s Paradox or Structural Efficiency Shift
The publication of DeepSeek’s results in late January 2025 represented the most significant single stress test of the AI capex thesis since the cycle began. The claim — a competitive reasoning model trained in approximately two months for under $6 million using roughly 10,000 Nvidia GPUs — directly challenged the prevailing assumption that frontier AI performance required exponentially increasing compute spend. Markets responded with a single-session rout of approximately $1 trillion in equity value across US and European technology stocks. Nvidia’s market capitalisation declined by nearly $600 billion in a single day, the largest single-session market-cap destruction in recorded financial history, per multiple contemporaneous press accounts.
The critical observation is what happened next: hyperscaler capex guidance did not move. Amazon, Alphabet, Microsoft, and Meta each subsequently reaffirmed or increased their 2025–2026 spending commitments. The analytical framework offered in defence of this posture was Jevons’s Paradox — the 19th-century economic principle that improvements in the efficiency of resource use tend to increase total consumption of that resource as applications proliferate. Applied to AI compute: cheaper inference does not reduce aggregate GPU demand; it expands the addressable application set to the point where total compute consumption rises. Jefferies described the market reaction as puncturing “capex euphoria” without altering the underlying demand dynamic.
The honest analytical position is that both interpretations have empirical support and both carry prediction uncertainty. Jevons dynamics are well-documented in energy and transportation. They are less well-tested in a sector where the primary input — GPU compute — is simultaneously subject to rapid architectural improvement, potential regulatory restriction on exports to key markets, and concentration of supply in a single dominant producer. The net effect on aggregate demand over a 36-month horizon is genuinely uncertain, and sell-side models that present either outcome with high confidence deserve scepticism.
What DeepSeek did establish unambiguously is that the compute efficiency frontier is moving faster than consensus assumed as recently as mid-2024. This has direct implications for hardware obsolescence risk — a point developed in the Risk Factors section below.
Risk Factors
Monetisation Lag and Free Cash Flow Deterioration. The most immediate risk to the AI infrastructure investment thesis is not technical but financial. Forrester Research projects that 25% of planned enterprise AI spending will be deferred to 2027 as firms fail to demonstrate near-term returns. If enterprise AI adoption — which drives inference revenue and ultimately justifies hyperscaler capex — lags the infrastructure build-out by 18–24 months, utilisation rates will disappoint in 2026 and early 2027, pressuring free cash flows that are already under strain. Amazon’s projected free-cash-flow negative position in 2026 is the clearest individual expression of this dynamic, but it applies across the cohort. At current US high-yield OAS of 271 basis points — tight relative to the period average of approximately 330 basis points, per ICE BofA data via FRED — markets are not pricing this risk with any meaningful premium.
Hardware Obsolescence and Stranded Asset Risk. GPU depreciation schedules typically span 4–5 years, a horizon over which architectural generations have historically turned over at least twice. The DeepSeek episode demonstrated that efficiency improvements can materially reduce the economic value of installed hardware well before book value reaches zero. If current-generation Blackwell or Hopper systems are rendered economically sub-optimal by next-generation architectures or software efficiency gains within 18–24 months, operators absorb stranded-asset costs at a scale — potentially hundreds of billions of dollars — that has no historical reference point in the technology sector.
Physical Infrastructure Constraints and Regulatory Friction. The IEEFA’s assessment that projected data-centre electricity demand in three US markets alone exceeds credible nationwide supply is a structural rather than cyclical constraint. Interconnection queues at major US utilities run 4–7 years in some regions, per energy sector reporting. Simultaneously, export controls on advanced semiconductors — currently targeting China but subject to policy change in either direction — introduce regulatory uncertainty that affects both the supply of chips to global hyperscalers and the competitive landscape for US AI operators. The broad US dollar index at 119.3, per FRED data, reflects a macro environment in which dollar strength could further complicate the economics of offshore AI deployment.
Gem Research Perspective
Our base case is that the AI infrastructure investment cycle is structurally anchored — the demand for compute is not a speculative artefact — but that the current phase represents peak rate-of-change rather than peak absolute spending. The moderation from 54% capex growth in 2025 to a projected 19% in 2026, per Morgan Stanley consensus data, is a natural and largely priced transition. What markets have not fully priced is the monetisation lag risk: the 18–24 month gap between infrastructure deployment and enterprise inference revenue at scale creates a cyclical air pocket in hyperscaler free cash flow that we expect to become a more prominent market narrative through Q3 and Q4 2026.
We do not subscribe to the bubble framing. The asset base being constructed — power-secured, purpose-built AI data centres with long-term utility contracts — has residual value characteristics that distinguish it from, for example, the overbuilt telecom fibre of the late 1990s. KKR and BlackRock are correct that energy, networking, and cooling constraints create durable pricing power for well-positioned operators. The hardware obsolescence risk is real but manageable for operators with the scale to absorb write-downs and the flexibility to redeploy infrastructure across model generations.
The primary indicator to watch is enterprise AI adoption velocity, measured through inference revenue growth at AWS, Azure, and Google Cloud in Q2 and Q3 2026 earnings releases. If inference revenue is growing at or above 40% year-on-year, the monetisation lag thesis loses force. If it is tracking below 25%, the cyclical air pocket is materialising and the sector’s premium valuation becomes difficult to sustain against deteriorating free cash flow. The VIX at 16.3, per CBOE data via FRED, signals that options markets are not pricing a near-term stress event — which, given the free cash flow trajectory at leading hyperscalers, strikes us as complacent.