
Executive Summary
- Global M&A value surged to an estimated $4.7 trillion in 2025, the strongest year since the 2021 peak, yet the recovery is structurally narrow — driven by a cohort of megadeals above $5 billion rather than a broad-based revival in deal frequency. Deal count of approximately 33,000 majority transactions in 2025 remains materially below the 2021 record of 41,300.
- A record $4.63 trillion in private market dry powder, with $1.1 trillion earmarked for PE buyouts, is creating an acute deployment imperative. More than 40% of that capital has been idle for over two years — 15 percentage points above the five-year average — placing sponsors under intensifying LP pressure to generate exits and new commitments.
- The rate environment remains a structural constraint on mid-market leveraged finance, even as sequential Fed cuts in late 2025 began to ease conditions at the margin. As of Q1 2026, the Fed Funds Rate stands at 3.64% and the 10-year Treasury yields 4.48%, per Federal Reserve data. The 10Y-2Y spread has fully unwound from its 2023 peak inversion of -108bps to a positive +46bps — a signal that the macro backdrop is normalising, though financing costs remain elevated relative to the 2020–2021 cycle.
- The regulatory environment under the Trump administration has shifted toward remedy-friendly, transparent engagement, reinstating HSR early termination and signalling preference for consent decrees over litigation — a meaningful tailwind for deal certainty, though enforcement has not retreated entirely: nine mergers were challenged in 2025 versus five in Biden’s final year.
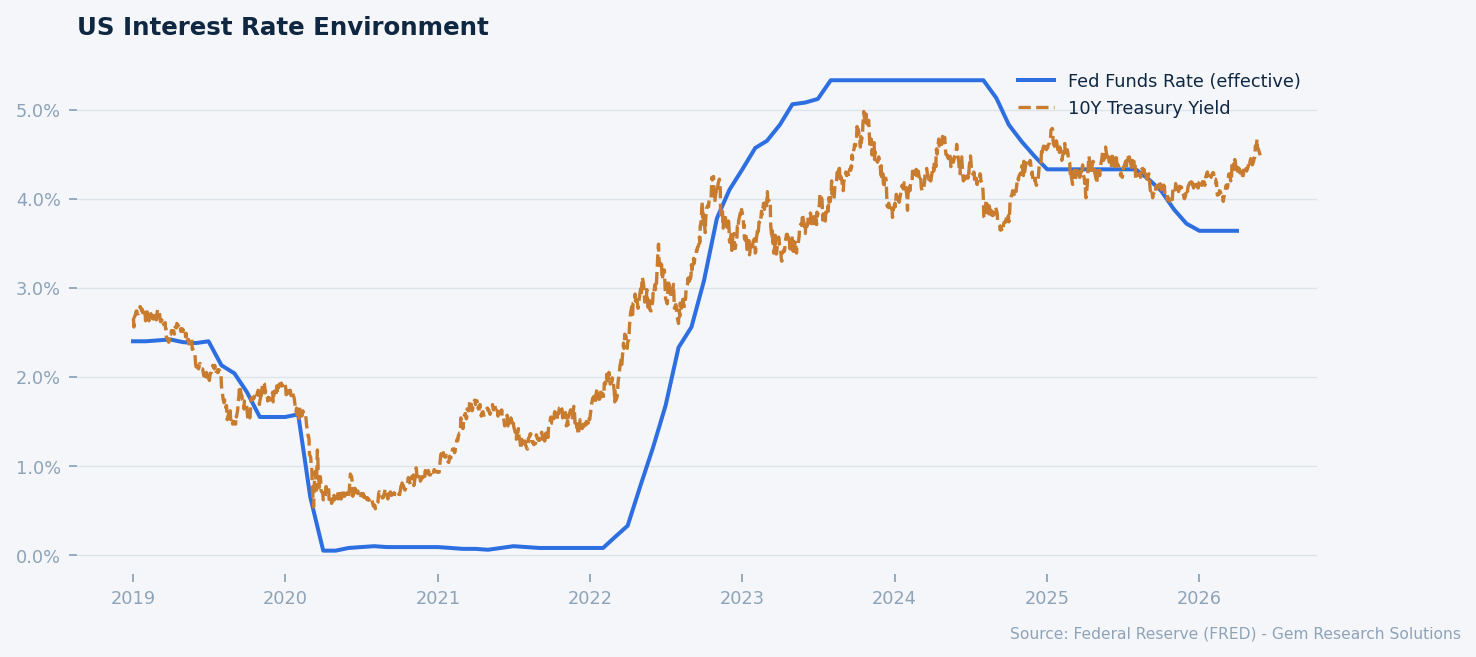
US interest rate environment: Fed Funds Rate vs 10Y Treasury. Source: FRED.
Market Overview
The 2025 M&A market delivered a recovery that, in aggregate volume terms, represents the strongest year since the 2021 peak — but the structure beneath the headline tells a more cautious story. Global deal value rose approximately 43% to $4.7 trillion against a ten-year average of $3.9 trillion, per data compiled by PwC and corroborated directionally by McKinsey’s private markets analysis. Yet deal count — the truer measure of dealmaker confidence across the full market — registered roughly 33,000 majority transactions, modestly below 2024’s 33,800 and far beneath the 2021 record of 41,300. Value is being driven by size, not frequency.
The macroeconomic backdrop framing this activity is one of managed deceleration rather than crisis. CPI headline inflation stood at 3.95% year-over-year as of the most recent Federal Reserve reading, with core CPI at 2.99% and PCE — the Fed’s preferred gauge — at 3.77%, still above the 2% target. Manufacturing capacity utilisation ran at 75.7% against a long-run average of 76.0%, reflecting an economy operating near but not at full industrial capacity. US private nonresidential fixed investment reached $3.8 trillion SAAR, underscoring continued corporate capital expenditure appetite. The S&P 500 at 7,520 — up 96.7% since January 2023, per FRED — provides strategic acquirers with a strong equity currency, while investment grade corporate OAS of just 74 basis points against a period average of approximately 120 bps reflects exceptionally tight credit spreads for investment grade borrowers, per ICE BofA data.
The defining feature distinguishing 2025 from prior post-rate-shock recoveries is a pronounced bifurcation. Strategic acquirers — corporates with strong balance sheets and access to equity markets trading at or near record levels — have been the primary engine of headline deal value. Financial sponsors, by contrast, face an asymmetric constraint: leveraged buyout economics remain challenged at a Fed Funds Rate of 3.64%, limiting deal count in the sub-$500 million segment while simultaneously concentrating PE activity in the largest transactions where debt service can be absorbed by scale. This bifurcation is expected to persist through 2026 unless the rate trajectory changes materially, with market consensus embedding one to two additional 25 basis point cuts over the year ahead.
Sectorally, technology led with 26 megadeals announced in 2025; banking followed with 13; manufacturing placed third with 11. Healthcare, examined in detail below, added 11 megadeals versus just three in 2024. The geographic locus of activity remains predominantly North American and European, though tariff and trade policy uncertainty materially dampened cross-border deal appetite — particularly Asia-Pacific inbound into the United States — through the first half of 2025. Resolution of that policy uncertainty represents a meaningful upside catalyst for 2026 cross-border volumes.
The Megadeal Resurgence: Strategic Concentration and Its Implications
The single most important structural development in 2025 M&A was the return of the megadeal. Transactions above $5 billion numbered 111, up 76% from 63 in 2024. The United States alone recorded four deals exceeding $40 billion in 2025, compared to zero in 2024. This is not a statistical anomaly — it reflects a deliberate strategic posture by large-cap corporates using elevated equity valuations and, in selective cases, investment grade debt at historically tight spreads to acquire at scale.
Investment grade OAS at 74 bps — against a period average closer to 120 bps, per ICE BofA and FRED — means that for IG-rated strategic acquirers, the all-in cost of acquisition financing is substantially lower than the headline rate environment implies. The US HY OAS of 271 bps against a period average of approximately 330 bps similarly reflects benign credit conditions for high-yield issuers, even if absolute rate levels are elevated. This spread compression is the transmission mechanism through which large strategic acquirers have continued to access attractive deal financing despite an ostensibly restrictive Fed posture.
Within technology, the AI infrastructure and data platform subcategory is attracting disproportionate interest. OpenAI’s acquisition of Torch — an AI-enabled health records platform — in 2025 represents an early-stage signal of a broader trend: technology acquirers are competing with PE for assets that combine proprietary data, AI workflows, and defensible customer bases. The Semiconductor IP Index reaching 178.2 versus approximately 105 in 2019 reflects the embedded valuation premium that intellectual property and technology moats now command in M&A pricing conversations.
The concentration risk in the current recovery is real and warrants clear-eyed acknowledgement. Headline global M&A value in 2025 is disproportionately accounted for by perhaps 200-300 transactions. Strip out the megadeal cohort, and the mid-market remains notably subdued. Two-thirds of US business leaders surveyed by Deloitte for its 2026 M&A Trends Survey indicated plans to increase M&A activity in 2026 versus 2025 — a constructive leading indicator — but the realisation of that intent is conditioned on financing conditions, regulatory clarity, and macroeconomic stability that cannot be assumed.
The forward implication for advisors and capital allocators is straightforward: deal flow in 2026 will continue to be driven by scale and strategic logic rather than financial engineering. Acquirers with strong equity currencies, investment grade credit access, and clear strategic rationale for transformative deals are best positioned. The mid-market revival, when it comes, will require two to three additional rate cuts beyond the current embedded market path.
Private Equity’s Dry Powder Dilemma: Deployment Pressure Meets Rate Reality
Private equity enters 2026 carrying the most consequential structural tension in its recent history: a record $4.63 trillion in total private market dry powder, $1.1 trillion of which is allocated specifically for PE buyouts, against a rate environment that makes the return arithmetic of leveraged buyouts genuinely challenging at the mid-market level. More than 40% of outstanding dry powder has been sitting idle for more than two years — 15 percentage points above the five-year average — generating increasing friction with LPs who expect capital to be deployed within fund lifecycles.
The buyout data for 2025 illustrates the bifurcation acutely. Global PE buyout value rose approximately 20% to roughly $1.8 trillion. Transactions above $500 million surged 51% in value to over $900 billion; deals above $2.5 billion jumped 72% to over $600 billion. The headline transaction — the $56.6 billion take-private of Electronic Arts — set a new all-time buyout record. Meanwhile, buyout count fell 5% globally, with North America declining 7%. Sponsors are writing larger cheques for fewer deals, concentrating in assets large enough to absorb debt service costs and defensible enough to command premium exit multiples.
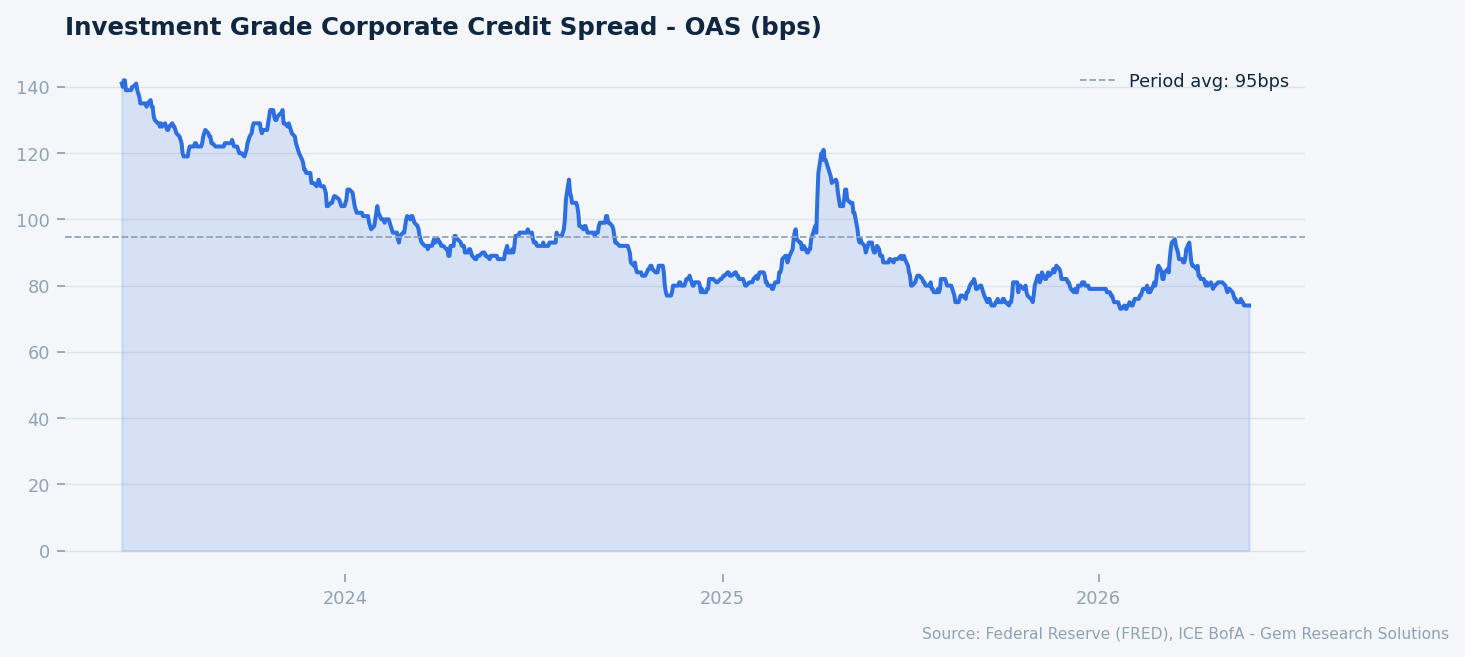
Investment grade corporate credit spread OAS (bps). Source: FRED, ICE BofA.
The exit environment remains the central bottleneck. Portfolio company holding periods have extended materially, and the IPO window — while improving from 2023–2024 lows — has not reopened sufficiently to clear the backlog. Sponsors facing fund lifecycle pressures are increasingly exploring continuation vehicles, secondary market sales, and dividend recapitalisations as alternatives to traditional exit routes. Each of these paths carries its own cost and signalling risk. The net result is a pipeline of forced sellers that will, in Gem Research’s assessment, become the defining feature of PE deal flow through 2026 and into 2027.
Rate trajectory is the critical swing variable. Market consensus, as reflected in Fed Funds futures pricing, embeds one to two additional 25 basis point cuts in 2026, which would bring the policy rate to a range of 3.14%–3.39%. That incremental easing is meaningful at the margin for LBO underwriting, but not transformative. A scenario with two cuts would revive mid-market buyout activity in a measurable way; a pause driven by re-acceleration of PCE — currently at 3.77%, well above target — could extend the current bifurcation further into 2027. Tax policy tailwinds from the One Big Beautiful Bill Act, as flagged by KPMG and EY, provide an additional stimulus to deal economics for domestic US transactions, potentially accelerating deployment of domestically oriented PE strategies.
Healthcare M&A: Structural Demand and Record PE Deployment
Healthcare was the standout sector in 2025 M&A by the measure that matters most — not just headline value but the structural durability of demand drivers. Global healthcare M&A values rose 46% in 2025 despite a 5% volume decline, a pattern precisely mirroring the broader market but amplified in scale. Healthcare PE delivered its highest-ever disclosed deal value at an estimated $191 billion, surpassing the previous record set at the 2021 peak.
The transaction catalogue is instructive. Abbott’s planned $21 billion acquisition of Exact Sciences targets the diagnostic oncology segment, where liquid biopsy and early-detection platforms command premium valuations. Hologic’s $18.3 billion go-private, backed by Blackstone and TPG, represents the largest healthcare take-private in years and signals PE’s conviction that a more certain regulatory environment justifies premium pricing for durable healthcare assets. Boston Scientific’s $14.5 billion acquisition of Penumbra, announced in January 2026, extends the strategic consolidation in medical devices. Disclosed medtech M&A exceeded $80 billion in 2025. Life sciences broadly recorded 193 transactions totalling $220 billion through November 2025, with pharma accounting for more than half of deal value.
Into 2026, the pace has not relented. Eli Lilly’s $7.8 billion acquisition of Centessa Pharmaceuticals, completed in March 2026, and its $7 billion acquisition of Kelonia Therapeutics in April 2026, demonstrate that large-cap pharma with strong balance sheets and GLP-1-driven cash generation is actively using M&A to build out pipeline depth. Gilead Sciences’ $3.15 billion upfront acquisition of Tubulis — with $1.85 billion in contingent milestones — in April 2026 targets antibody-drug conjugate oncology, a therapeutic modality attracting strategic premium pricing.
The structural logic is durable. Demographic ageing across developed markets creates secular demand growth that is largely rate-insensitive. Patent cliffs at major pharmaceutical companies — the industry collectively faces approximately $200 billion in branded drug revenue exposure through 2030 — create a non-discretionary imperative for pipeline replenishment via acquisition. Healthcare IT and digital health assets are attractive to both strategic buyers seeking data assets and PE sponsors seeking recurring revenue. The regulatory environment under the Trump FTC, discussed below, has generally been permissive for vertical integration in healthcare, though horizontal consolidation in health insurance and hospital systems continues to attract scrutiny.
Risk Factors
Inflation re-acceleration and a Federal Reserve policy reversal. PCE inflation at 3.77% year-over-year — 177 basis points above the Fed’s 2% target — leaves the FOMC with limited room to ease further without risking a credibility problem. A scenario in which resilient services inflation, tariff pass-through, or a labour market rebound forces the Fed to pause or reverse the modest easing cycle begun in late 2025 would be sharply negative for mid-market deal activity. High yield OAS at 271 bps, below the period average of 330 bps, suggests credit markets may be pricing a benign rate path that is not guaranteed. A spread widening event — triggered by a macro shock, credit event, or abrupt Fed repricing — could freeze leveraged finance markets and stall the nascent PE deployment cycle.
Antitrust enforcement uncertainty and leadership instability at the DOJ. The resignation of Gail Slater as DOJ Antitrust Division chief on February 12, 2026, and her replacement by Acting AAG Omeed Assefi introduces a degree of policy uncertainty at the agency responsible for reviewing the largest transactions. While the overall Trump-era posture favours remedies over litigation, an acting leadership structure is inherently less predictable. The FTC challenged nine mergers in 2025 — more than the five challenged in Biden’s final year — using conventional theories of harm. The Edwards Lifesciences/JenaValve block in August 2025 is a reminder that the new regime does not represent unconditional regulatory permissiveness, particularly in concentrated healthcare markets.
Tariff and trade policy uncertainty constraining cross-border deal appetite. Tariff-driven uncertainty visibly suppressed cross-border M&A activity through the first half of 2025, particularly Asia-Pacific and European inbound US deal flow. While some resolution has occurred, the structural unpredictability of US trade policy under the current administration creates ongoing friction for international acquirers underwriting synergy assumptions across jurisdictions. A meaningful escalation in trade tensions — particularly involving semiconductor, pharmaceutical, or advanced manufacturing supply chains — could materially reduce the cross-border component of the global M&A market, which historically accounts for 30%–35% of total deal value.
Gem Research Perspective
Our analytical call on 2026 M&A is constructive but deliberately qualified. We expect total global M&A value to reach approximately $3.8 trillion in 2026, supported by three durable forces: PE exit pressure creating a predictable pipeline of forced sellers; strategic corporate acquirers with strong equity currencies and investment grade access executing transformative transactions; and healthcare and technology sectors where fundamental demand drivers are largely independent of the rate cycle.
The critical variable to monitor is the Federal Reserve’s rate path relative to PCE trajectory. Our base case assumes one additional 25 basis point cut by year-end 2026, bringing the Fed Funds Rate to 3.39%. Under that scenario, mid-market LBO activity begins to recover modestly in the second half of 2026, and PE deployment pressure begins to clear the dry powder backlog in a more orderly fashion. A downside scenario — PCE re-acceleration above 4% forcing a Fed pause — keeps deal flow concentrated at the top of the size distribution and extends the bifurcation dynamic into 2027.
We would specifically watch three leading indicators: high yield OAS for signs of spread widening beyond the 330 bps period average, which would signal deteriorating leveraged finance conditions; the pace of HSR early termination grants at the FTC as a proxy for regulatory processing speed; and quarterly PE exit volume data as the clearest real-time signal of whether sponsor deployment is clearing inventory or creating a larger overhang. The fundamental deal-making impulse is present. The rate and regulatory environments are, on balance, more accommodating than at any point since 2022. Execution risk — not strategic intent — is the binding constraint.