
Executive Summary
- Supercore inflation has re-accelerated: Services CPI ex-energy ex-shelter reached 3.3% YoY as of April 2026, per BLS, up from 3.1% the prior month and driven by a 0.6% MoM jump in January 2026 alone — signaling that demand-driven services inflation is not decelerating toward the Fed’s 2% target on any near-term timeline.
- The shelter disinflation thesis has run its course without delivering the final mile: OER and primary rent were expected to be the mechanical disinflationary driver through 2025–2026; that process is largely complete, yet core CPI remains at 2.99% YoY and core PCE at 3.77% YoY, per FRED data, as of the most recent readings — both materially above target.
- The Fed’s easing path has narrowed sharply: The March 2026 FOMC dot plot projects at most one additional 25bp cut by December 2026, and market-implied probability of zero 2026 cuts sits at 30–40%. Fed Governor Michael Barr has stated it is “appropriate to hold rates steady for some time,” and PIMCO CIO Dan Ivascyn has publicly flagged a non-trivial probability of rate hikes resuming.
- A double-barreled inflation problem has emerged: Tariff passthrough is adding renewed upward pressure to core goods — core goods rose 0.84% MoM in February 2026, the fastest since January 2022, per BLS — coinciding with persistent services stickiness, materially complicating the soft-landing scenario that markets priced heavily through 2025.
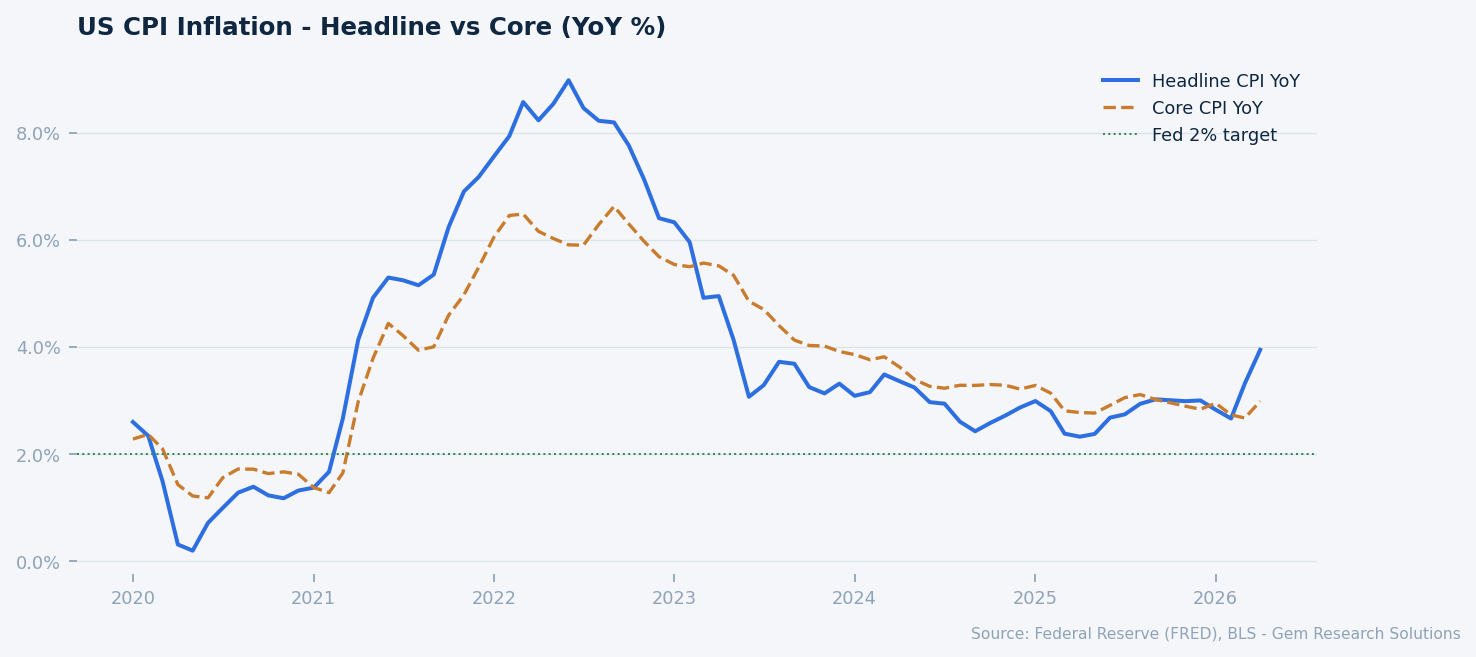
US CPI: Headline vs Core (YoY %). Source: FRED, BLS.
Market Overview
The inflation narrative that defined 2022–2024 — a sharp rise followed by a controlled disinflation — has entered a qualitatively different phase in 2026. The initial disinflation was largely mechanical: goods prices normalized as supply chains healed, energy prices retreated from post-invasion peaks, and shelter inflation was widely expected to decelerate as pandemic-era lease renewals cycled through the CPI basket. That mechanics-driven phase is now exhausted. What remains is structurally harder to dislodge.
As of the April 2026 BLS release, headline CPI stands at 3.95% YoY, with a monthly gain of 0.6% — the largest since early 2022. Core CPI is 2.99% YoY. The Federal Reserve’s preferred measure, core PCE, registered 3.77% YoY per FRED, with the three-month annualized pace accelerating to 4.4% as of March 2026, up sharply from 2.4% in November 2025. This re-acceleration, measured on the Fed’s own preferred gauge, is the defining development of early 2026 and the reason the soft-landing debate has re-opened rather than closed.
Financial markets have absorbed the inflation persistence with relative calm. The S&P 500 stands at 7,520, up approximately 96.7% from January 2023, per FRED data. The VIX is 16.3, below the conventional stress threshold of 20. High-yield OAS at 271bps and investment-grade OAS at 74bps both trade well through long-run averages of approximately 330bps and 120bps respectively, per FRED, suggesting credit markets are not pricing a hard landing. The 10-year Treasury yield is 4.48% and the 10Y-2Y spread has unwound to +46bps from the -108bps inversion peak of 2023, per Federal Reserve data — a normalization that under conventional interpretation signals reduced near-term recession risk.
The tension the report addresses is therefore not between growth and recession, but between the resilience of economic activity and the stubbornness of services inflation that the current policy rate — at 3.64% Fed Funds effective rate per FRED — appears insufficient to break. The soft-landing thesis survives, but in materially narrowed form. The central question is whether the economy can sustain sub-3% core inflation without a labor market correction that has, as of this writing, not materialized.
Supercore Persistence: The Wage-Price Mechanism Remains Operative
The analytical center of gravity at the FOMC since 2023 has shifted toward supercore CPI — services excluding energy services and shelter — because this component most directly captures demand-driven, domestically generated inflation. Chair Powell has referenced it explicitly as the best real-time signal of underlying inflationary pressure. As of April 2026, supercore stands at 3.3% YoY, per BLS, up from 3.1% the prior month.
The January 2026 monthly reading is particularly notable: supercore rose 0.6% MoM, driven by a 6.5% spike in airline fares and accelerating medical care services costs linked to nationwide healthcare worker labor actions that ran through much of 2025. These were not statistical flukes. The airline fare surge reflects a combination of demand resilience and fuel cost passthrough from elevated oil prices associated with the US-Iran conflict escalation. The medical care acceleration is more durable: post-strike labor contracts in the healthcare sector are locking in multi-year wage premiums that BLS data show feeding directly into medical care services CPI.
The underlying mechanism is well-documented in San Francisco Fed research: in labor-intensive services industries, wage growth is the primary cost input, and nominal wage growth has not declined to levels consistent with 2% PCE inflation at current productivity trends. The Fed Funds rate at its current effective level of 3.64% per FRED — down from the 5.33% peak — has not generated the labor market slack necessary to cool services pricing materially. Payrolls have remained firm through Q1 2026, and unemployment has not risen to levels that historically correspond with supercore deceleration below 3%.
Core services account for approximately 60% of core PCE. If supercore breaks above 3.5% on a sustained basis — the scenario Goldman Sachs identified as effectively closing the door on 2026 cuts — the Fed faces a binary choice: recommit to a higher-for-longer posture well into 2027, or accept that its 2% target is effectively a medium-term aspiration rather than a near-term operational constraint. Neither path is cost-free. The former risks a sharper labor market correction than current consensus expects; the latter risks a de-anchoring of inflation expectations that has not yet materialized but which the Fed would view as a severe failure of institutional credibility.
Shelter Disinflation: The Mechanical Driver Has Exhausted Itself
The original architecture of the soft-landing thesis rested on a predictable, quantifiable disinflationary impulse from shelter. The logic was straightforward: CPI shelter components — owners’ equivalent rent (OER) and primary rent — are computed using a lagged methodology that causes them to reflect market rents with an approximately 12–18 month delay. As pandemic-era lease renewals cycled through the data, OER and primary rent were projected to contribute 50–70bps of mechanical CPI deceleration through 2025 into early 2026. That projection was largely accurate. The process is now complete.
What the thesis underestimated was the residual. Even with shelter disinflation fully realized, core CPI remains 99bps above the Fed’s 2% target and core PCE remains 177bps above it, per FRED data. The April 2026 BLS release showed the shelter index rising 0.6% MoM — a re-acceleration that suggests even the lagged relief from shelter has not persisted as a disinflationary tailwind into Q2 2026. This reflects a housing market dynamic where supply constraints, elevated mortgage rates at 4.48% on the 10-year, and strong household formation among millennials are keeping market rents from falling in the largest metropolitan areas.
The structural divergence between CPI and PCE is now analytically material. Shelter represents approximately 34% of the CPI basket but only approximately 15% of the PCE basket, per BLS and BEA methodology. This weighting difference means the two indexes are now telling meaningfully different stories about the inflation outlook. Core PCE at 3.77% YoY runs above core CPI at 2.99% YoY in part because PCE weights healthcare services at approximately 17% of its basket — a category where cost pressures are acute and accelerating — versus CPI’s lower healthcare weight. Investors and policymakers who track only CPI are receiving a more favorable signal than the Fed’s preferred measure warrants.
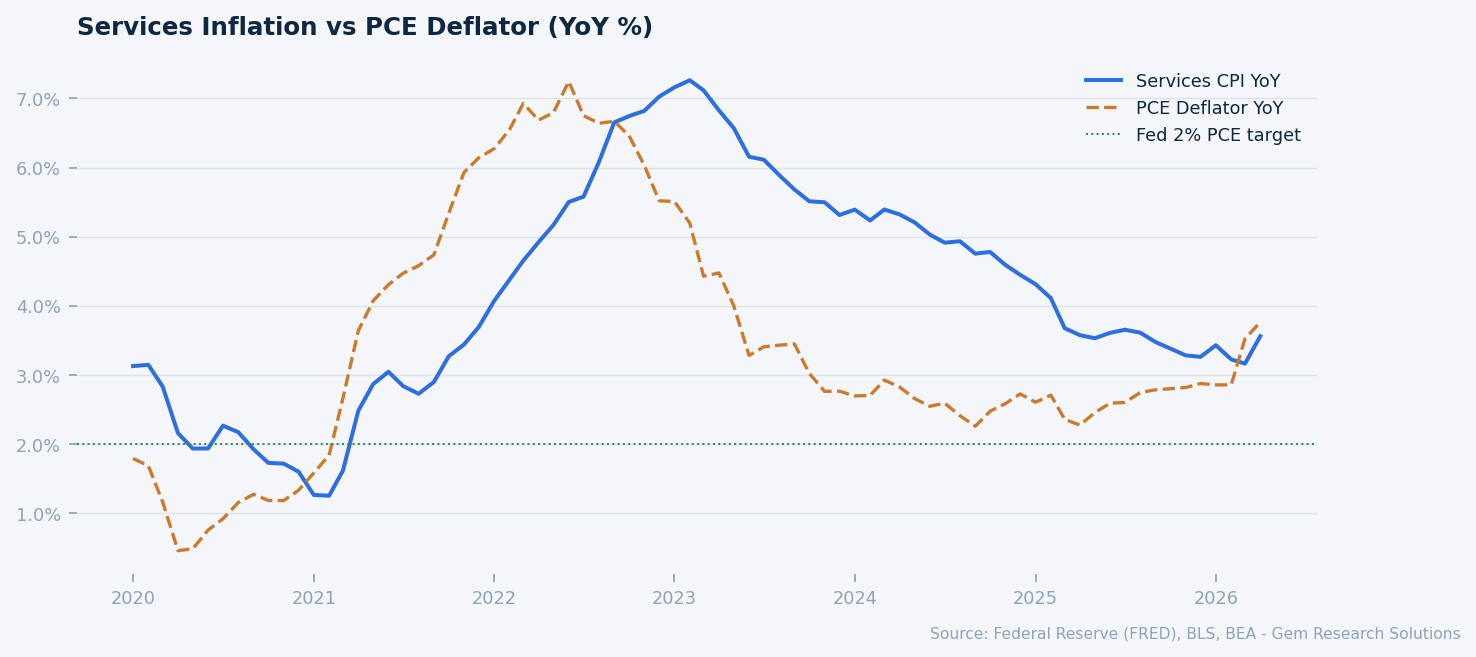
Services CPI vs PCE Deflator (YoY %). Source: FRED, BLS, BEA.
The implication for policy is that the shelter channel, which provided the primary disinflationary alibi for rate cuts priced into markets during 2025, can no longer be relied upon. The Fed’s forward guidance must now rest on actual services deceleration — which has not arrived — rather than on anticipated mechanical relief from rent components. This narrows the credible policy space for easing considerably.
Tariff Passthrough: Goods Re-Acceleration Adds a Second Inflation Vector
Goods prices were the primary disinflationary force of 2023 and 2024. As supply-chain normalization proceeded and consumer demand rotated back toward services, core goods CPI fell sharply, at points contributing negative YoY readings that mechanically suppressed headline and core measures. That disinflationary tailwind from goods is now reversing. Core goods CPI rose 0.84% MoM in February 2026, the fastest monthly gain since January 2022, per BLS — a development Goldman Sachs attributed primarily to tariff passthrough accelerating through import-dependent categories.
The tariff architecture in place as of Q1 2026 affects a broad set of consumer goods categories, with the sharpest near-term impacts in apparel, electronics, and household durables. Goldman Sachs revised its inflation playbook in May 2026 to incorporate this passthrough, projecting core PCE will remain near 3% through most of 2026 before declining to 2.5% by December 2026 and 1.9% by end-2027. Critically, Goldman models the peak goods price impact occurring in mid-2026, followed by a gradual fade. If that goods deceleration materializes as services simultaneously cool, the disinflation path reopens. If goods re-accelerate alongside persistent services inflation, the stagflation framing — which was largely absent from sell-side forecasts through 2025 — re-enters the analytical mainstream.
PIMCO CIO Dan Ivascyn has positioned his firm’s public commentary at the hawkish end of this distribution. Ivascyn has explicitly stated that a rate hike cannot be ruled out, citing the confluence of geopolitical energy shocks — specifically the oil price impact of the US-Iran conflict escalation — with the tariff goods passthrough and sticky services. His framing of rate cuts as “counter-productive given the inflation dynamic” represents a minority but non-trivial view within institutional fixed income. The US Dollar Broad Index at 119.3 per FRED provides partial offset to import price inflation, but a strengthening dollar also compresses export competitiveness and creates its own set of cross-asset tensions.
Private nonresidential fixed investment running at $3.8 trillion SAAR, per FRED, indicates that corporate capital deployment has not retreated despite policy uncertainty — a double-edged signal. Investment activity supports growth but also sustains aggregate demand in a way that limits the disinflationary impulse from any given rate level. Manufacturing capacity utilization at 75.7%, marginally below the long-run average of 76.0%, per FRED, suggests limited slack in the industrial economy to absorb demand pressures without price passthrough.
Risk Factors
Energy shock re-escalation. The Semiconductor IP Index at 178.2 versus approximately 105 in 2019 per FRED reflects a structurally more energy-intensive and logistics-intensive global supply chain. An escalation of the US-Iran conflict beyond current levels could drive crude oil materially above current pricing, feeding both headline CPI directly and services costs indirectly through transportation and logistics. PIMCO’s Dan Ivascyn has specifically identified this channel as the most credible path to a scenario where the Fed’s next move is a hike rather than a cut. The market does not appear to be pricing this risk: the VIX at 16.3 and HY OAS at 271bps suggest complacency that could unwind rapidly on a supply shock.
Healthcare labor cost entrenchment. The 2025 healthcare worker labor actions that drove the January 2026 supercore spike were not a one-time event. BLS data show medical care services inflation accelerating on a multi-month basis, and multi-year wage contracts negotiated through post-strike settlements lock in cost structures that are effectively insensitive to Fed policy. Healthcare represents approximately 17% of the PCE basket per BEA methodology. If medical care services inflation runs at 4–5% YoY on a sustained basis, it alone contributes 68–85bps to core PCE independent of all other categories — making the 2% target unreachable without offsetting deflation elsewhere.
Inflation expectations de-anchoring. Long-run inflation expectations have remained reasonably well-anchored through 2025–2026, but the sustained period of above-target inflation — now entering its fourth year — creates a cumulative risk that household and business expectations shift upward. The Atlanta Fed’s sticky-price CPI series, which tracks goods and services with prices that change infrequently and therefore reflect embedded expectations, has not broken higher as of this report, but its trajectory warrants close monitoring. A de-anchoring event would require a materially more aggressive policy response than the current dot plot contemplates.
Gem Research Perspective
Our base case is that core PCE finishes 2026 in the 2.6–2.9% range — below the current 3.77% YoY reading as tariff passthrough peaks and partially fades in H2 2026 per Goldman Sachs modeling, but above the level needed to trigger the rate cuts that markets began 2025 pricing aggressively. We expect the FOMC to execute at most one 25bp cut in December 2026, and assign a 35% probability to a no-cut outcome for the full calendar year. A rate hike remains a tail risk, but is not our base case absent a further energy shock or a supercore print above 3.5% that sustains for two or more consecutive months.
The critical variable to watch through Q3 2026 is whether the goods-services inflation dynamic resolves in the benign sequence Goldman models — goods peaking and fading as services gradually cool — or whether both remain elevated simultaneously. The latter scenario would compress the Fed’s credibility window and introduce the stagflation vocabulary that institutional forecasters have been deliberately avoiding. We are watching healthcare services CPI monthly readings, the three-month annualized supercore pace, and any revision to the FOMC’s r-star estimates in the June 2026 SEP as the three most actionable leading indicators for this call. The soft-landing remains our modal outcome, but its probability has declined materially from the consensus view that prevailed entering this year.