
Executive Summary
- Equity markets remain elevated but not obviously fragile. The S&P 500 stands at 7,520 as of May 2026 — up 96.7% versus January 2023, per Federal Reserve data — supported by resilient earnings, receding recession fears, and a VIX of 16.3, well below the distress threshold of 20. Valuations are stretched, with a trailing P/E near 27.3x and a Shiller CAPE of approximately 39, but the macro backdrop is not yet deteriorating in ways that historically precede multiple compression.
- Earnings broadening is the central structural development of 2026. Consensus S&P 500 EPS growth for the full year stands at 14–16%, and critically, the non-Magnificent Seven cohort posted 12%+ earnings growth in Q3 2025 — with that pace expected to roughly double relative to 2025 for the full year 2026. The Mag 7’s share of aggregate index earnings growth fell to 31% in Q3 2025, from over 50% in prior periods, per J.P. Morgan research.
- International equities are a structural overweight for H2 2026. The MSCI World ex-USA index surged 32.6% in 2025, and international developed markets are up approximately 12% year-to-date in 2026, outpacing US equities by roughly 4 percentage points. USD weakness — the Broad Dollar Index stands at 119.3 per Federal Reserve data — and persistent valuation discounts in European and Japanese equities sustain the rotation thesis.
- Trade policy remains the primary binary tail risk. Trump’s April 2025 “Liberation Day” tariff package triggered an 11% S&P 500 drawdown in two sessions. While a partial rollback has stabilized markets, renegotiation timelines represent a genuine H2 2026 event risk, particularly for multinationals with Asia-Pacific supply chain exposure.
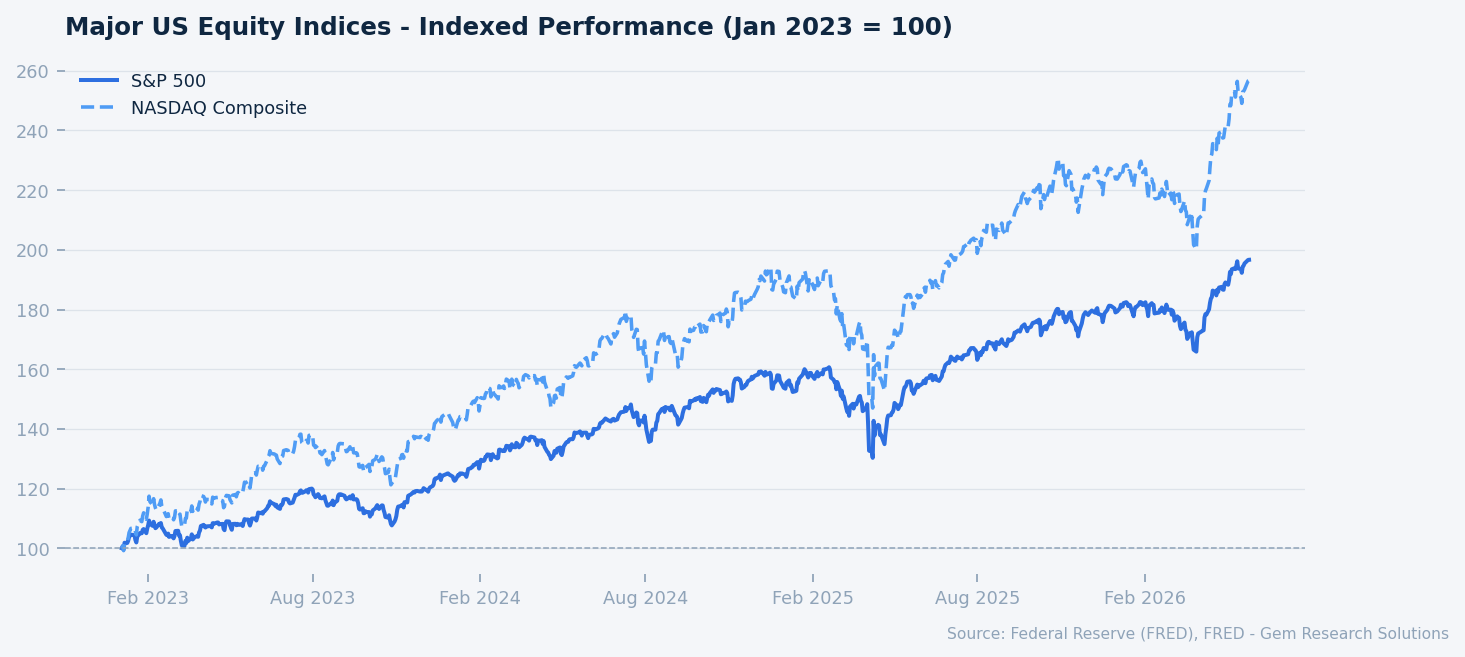
Major US equity indices indexed to Jan 2023 = 100. Source: FRED.
Market Overview
Global equity markets enter mid-year 2026 in a state of managed tension: sentiment is constructive, volatility is suppressed, and institutional positioning remains broadly risk-on, yet valuations have moved to levels that leave little margin for policy error or earnings disappointment. The S&P 500 at 7,520 and the NASDAQ at 26,675 represent the culmination of a multi-year recovery and expansion cycle that began in earnest in early 2023, driven first by AI-linked mega-cap multiple expansion and latterly by a genuine broadening of corporate earnings power.
The macroeconomic backdrop, while not benign in every dimension, is more supportive than conditions twelve months ago. The Federal Reserve has executed three rate cuts from its 2023–2024 peak, bringing the federal funds rate to 3.64%, per Federal Reserve data. Simultaneously, the 10-year Treasury yield holds at 4.48%, and the 10Y-2Y spread — which reached an inversion peak of -108bps in 2023 — has fully unwound to +46bps as of May 2026, per Federal Reserve data. This normalization of the yield curve is a material development: historically, it has coincided with improving credit conditions and reduced recession probability, though the transmission lag warrants caution.
Credit spreads corroborate the constructive tone. US high-yield option-adjusted spreads stand at 271bps, well inside the period average of approximately 330bps, and investment-grade OAS of 74bps compares favorably against a historical average near 120bps, per Federal Reserve data. These are tight conditions. They reflect strong corporate balance sheets and robust demand from institutional fixed income allocators, but also imply that any exogenous shock — a tariff escalation, a hard landing signal — would likely produce spread widening of consequence.
Consumer price pressures are moderating but not resolved. CPI headline inflation sits at 3.95% year-over-year and core CPI at 2.99%, per BLS data. PCE — the Fed’s preferred gauge — is at 3.77% year-over-year, per Bureau of Economic Analysis data, still materially above the 2% target. The Fed’s hold posture through year-end 2026 is therefore well-telegraphed. The central question is whether the next move is a cut in response to labor market softening, or a hold extended into 2027 if services inflation proves stickier than consensus expects. Either scenario has meaningful implications for equity risk premiums, which are already near historically narrow levels.
Against this backdrop, US private nonresidential fixed investment is running at $3.8 trillion SAAR, per Federal Reserve data, reflecting continued AI infrastructure buildout and an industrializing reshoring impulse. Manufacturing capacity utilization stands at 75.7% versus a long-run average of 76.0%, per Federal Reserve data — near-normal, indicating the industrial economy is neither overheating nor in meaningful contraction.
Earnings Broadening: The Bull Case Matures
The most consequential structural development in US equity markets during the first half of 2026 is the documented broadening of earnings growth beyond the Magnificent Seven technology mega-caps. For much of the 2023–2025 rally, the index-level earnings narrative was effectively a seven-stock story. Apple, Microsoft, Nvidia, Alphabet, Amazon, Meta, and Tesla together drove more than 50% of aggregate S&P 500 earnings growth in the peak period and accounted for 53% of the index’s total return in 2025.
That dominance is measurably receding. Per J.P. Morgan research, the Mag 7’s share of aggregate S&P 500 earnings growth fell to 31% in Q3 2025. The non-Magnificent Seven cohort — the remaining 493 constituents — posted 12%+ earnings growth in that same quarter, a marked acceleration from prior periods when many sectors were experiencing earnings contractions or single-digit growth. Consensus projects that the broader S&P 500 cohort will roughly double its 2025 earnings growth pace for the full year 2026.
The source of this broadening matters analytically. J.P. Morgan estimates that AI-related capital expenditure and the early productivity gains from AI deployment are responsible for approximately 40% of 2026 consensus EPS growth. This is not purely a technology sector story — the efficiencies are flowing through to financial services, healthcare services, logistics, and industrials. The Semiconductor IP Index, at 178.2 versus approximately 105 in 2019 per Federal Reserve data, reflects the scale of underlying technology investment that is now translating into measurable productivity effects across the economy.
Crucially, the broadening thesis changes the risk profile of the market. A rally led by seven stocks is vulnerable to idiosyncratic risks, regulatory events, or a single earnings disappointment among a handful of names. A rally in which 493 companies are contributing double-digit earnings growth is more structurally durable and less susceptible to the concentration-related fragility that dominated institutional risk discussions throughout 2024 and early 2025. Oppenheimer’s year-end S&P 500 price target of 8,100, embedding a 26.5x forward multiple assumption, is contingent on this broadening thesis being validated through Q3 2026 earnings season. Goldman Sachs, with a more conservative 6% full-year gain forecast from year-start, models broadly stable multiples and treats the broadening narrative as necessary but insufficient on its own to justify further re-rating.
The risk to this thesis is a capex hangover in AI infrastructure. If hyperscaler spending — currently running at historically unprecedented levels — does not produce the monetization timelines management teams have projected, capex growth could slow sharply in 2027, removing one of the primary drivers of current earnings estimates. That scenario would likely hit the broader supply chain — semiconductors, data center real estate, utilities — rather than just the Mag 7 themselves.
International Equities: Dollar Dynamics and the Rotation Trade
The outperformance of international developed market equities has become one of the defining trades of 2025 and early 2026. The MSCI World ex-USA index surged 32.6% in 2025, driven by a combination of USD weakness, compelling relative valuations, and improving earnings trajectories in Europe and Japan. Through the first five months of 2026, international developed markets are up approximately 12%, outpacing the S&P 500 by roughly 4 percentage points.
The USD trajectory is the single most important swing factor for this trade. The Broad Dollar Index at 119.3, per Federal Reserve data, reflects a dollar that has weakened substantially from its 2022 peak but remains well above pre-pandemic norms. The policy divergence dynamic is instructive here. The Bank of Japan is expected to continue its normalization cycle, hiking rates incrementally while the Fed remains on hold. The ECB deposit facility rate stands at 2.00%, and European central bank policy is similarly likely to hold or ease modestly. This interest rate differential compression — particularly on the US-Japan axis — removes a primary prop for dollar strength and creates a structural tailwind for non-USD equity returns when translated back to dollar terms.
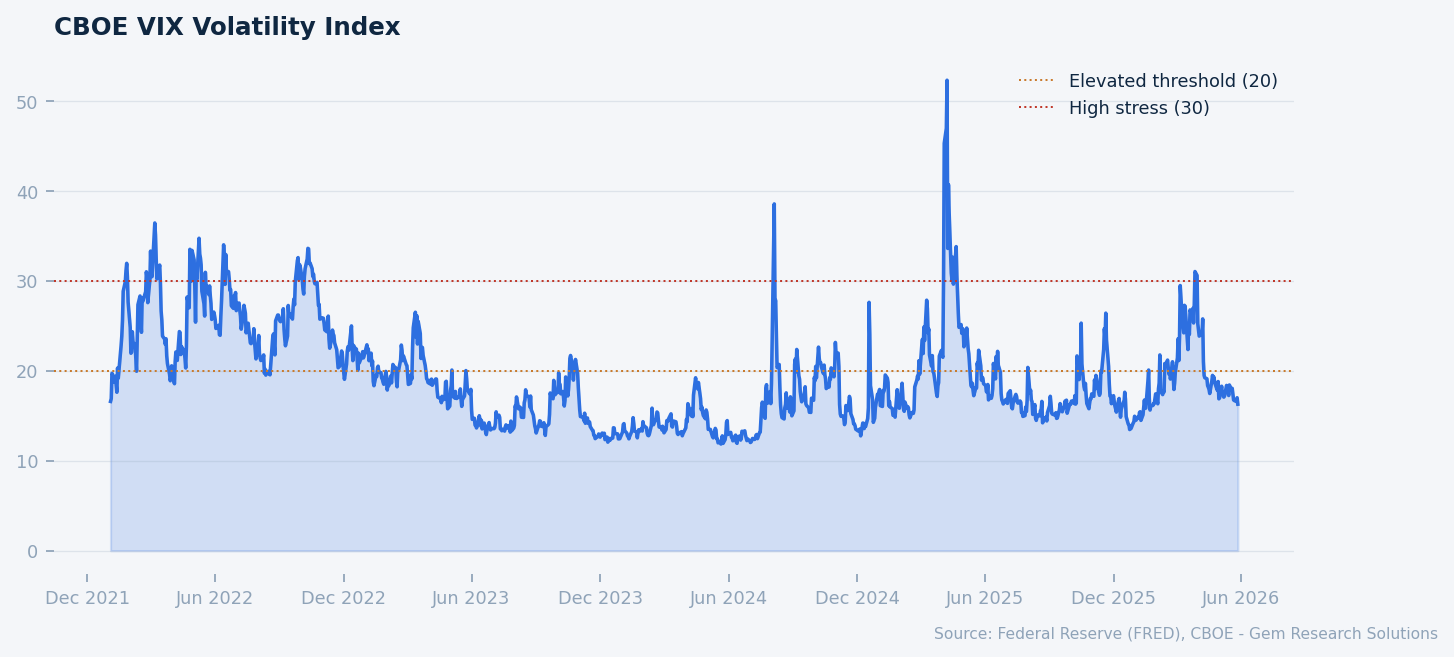
CBOE VIX Volatility Index. Source: FRED, CBOE.
Valuation remains a compelling argument for international allocation. European and Japanese equities continue to trade at material discounts to US peers on earnings, book value, and CAPE measures. Robert Shiller has projected European equities returning approximately 8.2% annualized over the next decade, against more modest expectations for US equities given the CAPE starting point near 39. Morningstar Indexes and Charles Schwab have both flagged continued international tailwinds through year-end 2026, and institutional allocators — including Cambridge Associates — are actively recommending rotation out of US large-cap overweights and into international developed, with selective emerging market exposure in countries less directly exposed to US tariff risk.
The caveat to the international bull case is that much of the easy money has been made. A 32.6% return in 2025 for MSCI World ex-USA brings valuations closer to fair value in several European markets. If the dollar stabilizes or rallies — for instance, in response to a tariff escalation that increases demand for USD-denominated safe assets — the currency tailwind that has been central to international returns could reverse quickly. Japanese equity valuations also become more complex if the yen appreciation from BOJ hikes begins to weigh on export sector earnings more materially than current consensus models.
Concentration Risk: Real, Monitored, and Moderating
Index concentration at the top of the S&P 500 remains at historically unprecedented levels, even as the underlying earnings story broadens. The Magnificent Seven collectively represent approximately one-third of S&P 500 total market capitalization, and the top 10 names account for roughly 40% of the index’s total value — an all-time high by this measure. For passive equity allocators — and passive vehicles now account for a majority of US equity AUM — this means that benchmark-tracking portfolios carry extraordinary single-name and single-sector concentration risks by historical standards.
Lord Abbett and Cambridge Associates have both explicitly flagged concentration as a primary portfolio risk heading into H2 2026. The practical manifestation of this risk is straightforward: a 10% correction in the Magnificent Seven collectively would reduce the S&P 500 by approximately 3.3% on concentration mechanics alone, before considering any second-order effects on investor sentiment or factor crowding. The equity risk premium — the spread between the forward earnings yield and the 10-year Treasury — has compressed to nearly zero, approximately 0.02%, per Goldman Sachs estimates. At this level, equities offer essentially no compensation for risk relative to risk-free alternatives, a condition that has historically been associated with elevated drawdown probability over medium-term horizons.
The market structure response is visible in fund flows. Institutional allocators are actively reducing Mag 7 overweights and rotating into US small-caps, international developed markets, and real assets. Small-cap valuations have recovered from their 2022–2024 distress levels but remain at meaningful discounts to large-cap peers on a price-to-book basis. If the earnings broadening thesis continues to play out — and small-cap companies tend to have higher domestic revenue shares, which partially insulates them from tariff-related earnings pressure — the rotation into small-caps could sustain for multiple quarters.
Critically, concentration risk is moderating rather than accelerating. The Mag 7’s falling share of earnings contribution — from over 50% to 31% in Q3 2025 — is the earnings-side manifestation of a market that is slowly distributing its growth drivers more broadly. Whether this transition completes smoothly or stalls depends largely on two variables: the sustainability of AI monetization timelines and the trajectory of the federal funds rate. A rate-cut cycle resumption in 2027 would likely disproportionately benefit small and mid-cap companies with floating-rate debt exposure, potentially accelerating the rotation dynamic that is already underway.
Risk Factors
Trade Policy and Tariff Escalation. Trump’s April 2025 “Liberation Day” tariff package triggered an 11% S&P 500 drawdown over two sessions — April 2–4, 2025 — and reduced S&P 500 dividend expectations by 6–8% on a three-year forward basis, per BCA Research estimates. BCA Research warned at the time of a potential S&P 500 decline to the 4,200–4,500 range if a tariff-induced recession materialized. A partial rollback stabilized markets, and strategist Ed Yardeni subsequently raised his S&P 500 target back to 6,500, per CNBC reporting. However, renegotiation timelines for remaining tariff packages — particularly regarding China semiconductor and consumer goods classifications — represent a genuine binary event risk for H2 2026. Any re-escalation that raises effective tariff rates substantially would simultaneously impair corporate earnings estimates and re-price the risk premium, a dual negative for equity valuations.
Sticky Inflation and Fed Policy Error. PCE inflation at 3.77% year-over-year, per Bureau of Economic Analysis data, is nearly double the Fed’s stated target. If services inflation proves structurally persistent — driven by shelter costs, healthcare, and wage-indexed service contracts — the Fed’s hold posture could extend well into 2027 or, in a tail scenario, require resumption of hikes. A rate increase in the context of a 27.3x trailing P/E S&P 500 would almost certainly compress multiples meaningfully. The equity risk premium near zero leaves no buffer for a scenario in which the risk-free rate moves higher.
AI Monetization Disappointment and Capex Cycle Reversal. With J.P. Morgan attributing roughly 40% of 2026 consensus EPS growth to AI-related capital expenditure and productivity, any material downward revision to AI monetization expectations carries significant index-level earnings implications. Hyperscaler capex is running at historically unprecedented levels; if return on that investment does not manifest in revenue and margin improvement on the timelines embedded in current consensus, 2027 earnings estimates could face substantial downward revision, pulling forward the multiple compression problem.
Gem Research Perspective
Our base case for H2 2026 is cautious constructiveness. The S&P 500 can reach 7,800–8,000 by year-end — consistent with Oppenheimer’s 8,100 target — but requires the earnings broadening thesis to hold through Q2 and Q3 reporting seasons and the tariff environment to remain stable at current effective rates. We do not expect meaningful Fed rate cuts before Q1 2027 at the earliest, given PCE at 3.77% and labor market data that has not yet signaled the softening required to reopen the easing window.
Our highest-conviction call is the continued outperformance of international developed market equities versus US large-cap on a 12-month horizon. The structural case — dollar weakness, valuation discount, BOJ normalization, improving European corporate governance — is intact. We would position a meaningful allocation to MSCI Europe and selective Japan exposure through currency-hedged vehicles for clients who want to reduce unintended FX beta.
The primary watch indicator for our scenario revision is the US HY OAS. At 271bps, spreads are pricing an almost perfectly soft-landing environment. If HY OAS widens above 350bps in response to any combination of the risk factors identified above, that signal would prompt us to reduce equity risk in client portfolios and extend duration in fixed income. We will also be monitoring AI capex guidance in the Magnificent Seven Q2 2026 earnings calls closely — any language suggesting capex moderation would, in our assessment, be a leading indicator of a 2027 earnings growth deceleration that the market is not yet pricing.