
Executive Summary
- Spreads are tight, but the underlying credit is not: EM corporate high-yield OAS stood at 269bps as of May 2026, per FRED and ICE BofA data — well inside the long-run period average of approximately 330bps — masking a bifurcated credit landscape where sub-investment-grade sovereigns face secondary market yields exceeding 10% on maturing hard-currency obligations.
- The dollar rebound is the operative stress variable: After the US Dollar Broad Index (DXY-weighted basis) dropped to multi-year lows early in 2026, a partial 4% recovery since January lows has re-introduced capital reversal risk across high-deficit EM economies, with Turkey, Nigeria, and Egypt representing the three most acute pressure points on the sovereign stress map.
- The refinancing wall is advancing, not retreating: EM hard-currency corporate bonds represent approximately $2.5 trillion in outstanding obligations — nearly double the US high-yield market at $1.3 trillion — yet net financing in this segment was negative for the fourth consecutive year in 2025, compressing new issuance to refinancing-only activity and pulling forward rollover concentration risk into 2027–2028.
- Bilateral and multilateral backstops are doing structural work that markets cannot: Egypt’s stabilisation depends entirely on $64bn in Gulf capital injections and an ongoing IMF Extended Fund Facility through October 2026. Without this extraordinary support architecture, the refinancing calculus across multiple EM frontier names collapses. The Common Framework restructuring pipeline — Ghana, Sri Lanka, and others — remains slow and creditor-fragmented.
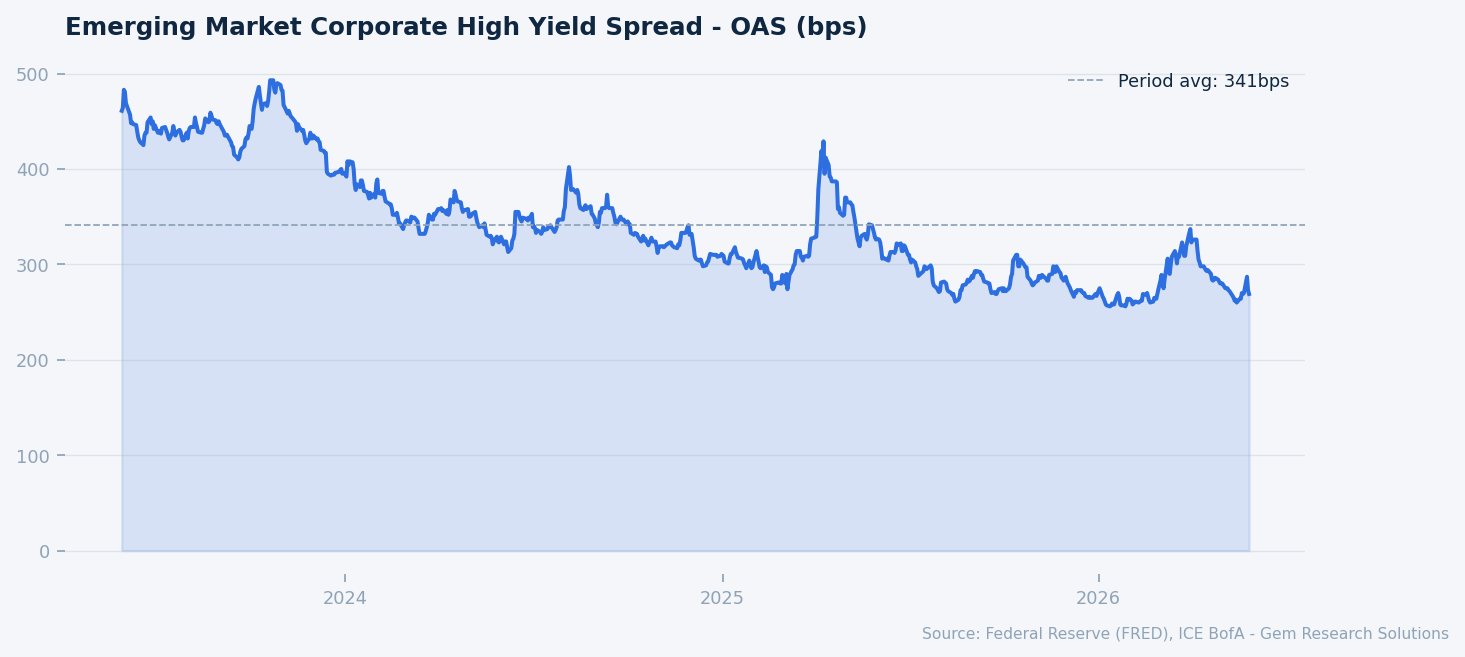
Emerging market corporate high yield spread OAS (bps). Source: FRED, ICE BofA.
Market Overview
Emerging market debt entered 2026 carrying a deceptive veneer of calm. Spread compression across investment-grade EM sovereign names reached levels not observed since October 2007, per ICE BofA index data, while aggregate EM growth projections of 3.9% for 2026 — up from 3.7% in 2025, per IMF World Economic Outlook estimates — provided a macro anchor that kept headline volatility subdued. The Federal Reserve’s easing cycle, which brought the fed funds rate to 3.64% as of May 2026 per Federal Reserve data, reduced the most acute phase of external financing pressure that had dominated EM credit markets through 2023 and 2024. The 10Y-2Y Treasury yield spread, which had peaked at a negative 108bps inversion in 2023, has since unwound to a positive 46bps spread as of May 2026 per Federal Reserve data — a technical normalisation that loosened global risk appetite and supported EM inflows through much of 2025.
But beneath this surface lies a materially more fragile credit environment. US CPI headline inflation remained at 3.95% year-over-year as of the latest BLS data, and PCE inflation stood at 3.77% per Federal Reserve data — both above the Fed’s 2% target, sustaining the argument that the easing cycle may be shallower and slower than EM borrowers require. The 10-year Treasury yield at 4.48% per Federal Reserve data represents a structurally elevated risk-free rate that continues to make EM hard-currency issuance expensive relative to the 2015–2021 financing window. US high-yield OAS at 271bps and IG OAS at 74bps — both meaningfully tighter than long-run averages of approximately 330bps and 120bps respectively, per FRED — reflect a US credit market pricing near-perfection, not stress. The contagion risk, should US credit begin to reprice, flows directly into EM spreads through the standard risk-off transmission channel.
The scale of EM hard-currency corporate debt — $2.5 trillion in aggregate outstanding — is a figure that systematically escapes mainstream fixed-income coverage, which remains disproportionately focused on US investment-grade and high-yield markets. Gross EM sovereign hard-currency issuance is projected to decline in 2026, reflecting both the elevated cost of external capital and a deliberate shortening of maturity profiles by sovereign borrowers seeking to avoid long-end rate exposure. That maturity compression, however pragmatic in the near term, is explicitly front-loading rollover risk into 2027 and 2028 — a dynamic that Gem Research views as the structural fulcrum on which the EM debt cycle will turn.
Dollar Dynamics and the External Financing Environment
The dollar remains the single most consequential variable for EM hard-currency stress, and in 2026 its behaviour has been neither uniformly hostile nor uniformly supportive — it has been erratic, which in many respects is worse. The US Dollar Broad Index stood at 119.3 as of May 2026 per Federal Reserve data. Earlier in the year, the DXY Index dipped below 97.0 to a four-year low, triggering significant repositioning: net outflows from US Treasuries reached $18bn in January 2026 alone, with a parallel $22bn outflow from US equities, per capital flow tracking data. That dollar weakness provided temporary relief for EM local-currency debt holders and compressed hard-currency borrowing premiums. The subsequent 4% rebound, however, reversed a portion of those gains and reintroduced the capital reversal dynamic that EM central banks most fear. The domestic plumbing sits underneath all of this: how dollar liquidity is behaving now that balance sheet runoff has ended sets the floor under funding costs that EM borrowers ultimately pay.
For EM issuers running large current account deficits — Turkey’s deficit is projected at approximately $45bn for 2026 — intermittent dollar strength is not a cyclical inconvenience. It is a structural refinancing constraint. Each dollar leg higher raises the effective cost of rolling hard-currency obligations, reduces the local-currency value of reserve buffers, and triggers portfolio outflows that can tip a manageable liquidity situation into a market access disruption. Turkey’s experience in March 2026 is instructive: carry trade unwinding triggered $7.3bn in bond and equity outflows and an estimated $15bn in carry position reversals, a sharp stress episode that illustrates how quickly dollar volatility transmits into sovereign credit events.
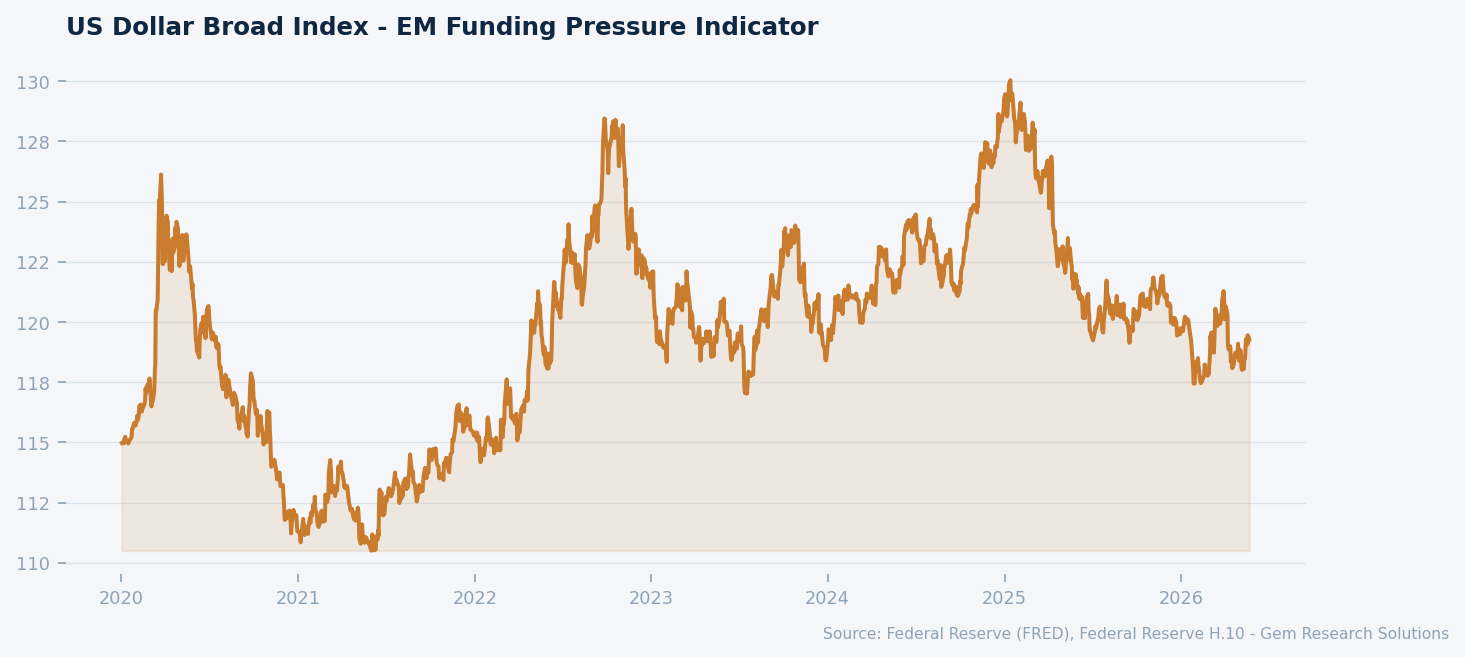
US Dollar Broad Index — EM funding pressure indicator. Source: FRED.
The broader structural context amplifies the near-term pressure. Central banks across EM economies have been accelerating de-dollarization, pivoting reserve allocation toward gold and non-dollar assets. While this is a legitimate long-run structural trend, it does not reduce near-term hard-currency refinancing burdens — the debt stock remains denominated in dollars, and the refinancing wall does not shift because reserve composition does. EM central bank rate-cutting cycles, which have mirrored the Fed’s pivot with cuts now embedded in 38% of EM central bank policy settings, risk getting caught between domestic inflation management and the need to maintain yield differentials that support capital retention. This is not a comfortable monetary policy position, and in several frontier economies it is already producing divergence between headline policy rates and effective market financing conditions.
The Sovereign Stress Map: Turkey, Egypt, and Nigeria
Three sovereign credits define the leading edge of EM debt stress in 2026, and each operates through a distinct but related transmission mechanism.
Turkey presents the most complex sovereign risk profile among large EM economies. The lira lost 21% against the dollar in 2025, moving from approximately 35 to 43 per USD, and CDS risk premiums breached 300bps — a nine-month high — following the March 2026 carry unwind. The Turkish Treasury faces a $19.9bn external debt repayment schedule in 2026 against planned issuance of only $13bn, creating a structural financing gap that reserves and bilateral relationships must bridge. Inflation at 32.9% versus the Central Bank of Turkey’s stated target of 24% demonstrates the limits of the disinflation programme under conditions of lira depreciation. The current account deficit of approximately $45bn projected for 2026 means Turkey is continuously dependent on external capital to fund its external position — a vulnerability with no near-term resolution under current policy parameters.
Egypt’s stabilisation is the most vivid example of what happens when market access fails and bilateral capital becomes the lender of last resort. External debt peaked near $168bn in 2023 before falling to $155bn in early 2025. The current framework is underwritten by a $7.45bn IMF Extended Fund Facility running through October 2026, a $1bn Resilience and Sustainability Facility, and an extraordinary constellation of Gulf capital: $35bn from the UAE (anchored by the $11bn Ras el-Hekma FDI transaction), $15bn from Saudi Arabia, $7.5bn from Qatar, and $6.5bn from Kuwait — a combined $64bn backstop that has no precedent in recent EM history. The fifth and sixth IMF programme reviews cleared in February 2026 with $2.3bn disbursed, conditional on Egypt maintaining a 4.8% of GDP primary surplus target for FY2025/26. Strip away this support architecture and Egypt’s refinancing position is acutely precarious. This is a credit that market pricing does not adequately reflect.
Nigeria represents the most acute fiscal stress in sub-Saharan Africa by several measures. The interest-to-revenue ratio exceeds 70% — a level that in developed market context would constitute a fiscal emergency. Debt servicing is projected to absorb 50–60% of federally retained revenue in 2026, with ₦15.81 trillion ($9.4bn equivalent) allocated to debt service in the 2026 federal budget. Eurobond external obligations reached $18.5bn by end-2025, and the Senate’s April 2026 approval of a fresh $6bn loan pushed total debt toward ₦155 trillion. The structural problem is compounding: naira depreciation raises the effective cost of dollar-denominated debt service in local revenue terms, while oil revenue volatility — the primary fiscal buffer — introduces a wildcard that could accelerate a liquidity crunch with limited warning.
The Refinancing Wall and Corporate Debt Exposure
The $2.5 trillion EM hard-currency corporate bond market is the underappreciated fault line in the global credit architecture. Its scale — nearly twice the $1.3 trillion US high-yield market — contrasts sharply with the attention it receives in mainstream fixed-income analysis. Net financing in EM corporate bonds was negative for the fourth consecutive year in 2025, a technical condition that has suppressed issuance supply and helped support spread levels that mask underlying credit deterioration. For EM high-yield corporates specifically, funding costs at or above the 269bps OAS level per FRED and ICE BofA data, layered on top of the base 4.48% 10-year Treasury yield, produce all-in borrowing costs that structurally exclude new money transactions. The market is open only for refinancing — and even then, only for credits with established investor bases.
The maturity structure of sovereign EM borrowing adds another dimension. Sovereigns are deliberately shortening maturities to avoid the long-end rate exposure that characterized the 2020–2021 issuance window. This is rational at the individual issuer level but collectively concentrates rollover risk in a narrower temporal window. The 2027–2028 maturity profile, on current trajectories, will represent a materially heavier refinancing burden than 2026 — and the base case assumes that rates will have declined sufficiently by then to make that wall manageable. If the Fed’s easing cycle proves shallower than the forward curve implies — a non-trivial probability given PCE at 3.77% per Federal Reserve data — that assumption fails.
The post-default restructuring pipeline illustrates the resolution timeline investors face when the refinancing wall becomes a crisis. Ghana completed Eurobond restructuring in June 2024 after entering default. Sri Lanka restructured $25bn of external debt with $3bn in creditor forgiveness, extending repayment across two decades, finalised in 2025. Both processes took materially longer and extracted larger creditor concessions than pre-default market pricing implied. The Common Framework — the G20/Paris Club mechanism designed to streamline sovereign restructuring for low-income countries — continues to operate below the speed required by the pace of sovereign stress events, with creditor coordination remaining the primary bottleneck. This slow resolution dynamic is a structural feature, not a transitional one.
Risk Factors
Three specific risk factors define the downside scenario architecture for EM debt in the 12-month forward horizon.
The first is a Federal Reserve policy reversal or plateau. With PCE at 3.77% and CPI headline at 3.95% per Federal Reserve data, the conditions for a resumption of Fed hawkishness are present if labour market data or services inflation reaccelerates. The fed funds rate at 3.64% is not historically restrictive; further easing is priced into EM sovereign spread levels and refinancing assumptions. A scenario in which the Fed pauses or reverses course would push the 10-year Treasury yield beyond 4.48%, tighten EM OAS, and simultaneously re-strengthen the dollar — a triple negative for EM hard-currency credits with large refinancing needs in 2026–2027.
The second is a Turkey-specific contagion event. The March 2026 carry unwind — $7.3bn in outflows, $15bn in carry reversals — was absorbed without a formal market access disruption. A repetition at larger scale, particularly if triggered by a lira depreciation that breaches investor tolerance thresholds, could produce a disorderly sovereign spread event that propagates across EM high-yield through the standard risk-off contagion channel. Turkey’s $6.9bn refinancing gap (difference between $19.9bn obligations and $13bn planned issuance) is the specific number that defines the line between managed stress and acute crisis.
The third risk is Nigeria’s oil revenue shock. At 50–60% of federally retained revenue allocated to debt service, Nigeria operates with no fiscal buffer against a sustained decline in crude oil prices or production disruptions. A 15–20% decline in oil revenue — well within historical volatility parameters — would shift Nigeria’s fiscal arithmetic from stressed to insolvent on a cash-flow basis, potentially triggering Eurobond market access disruption at a moment when sub-Saharan Africa’s sovereign-bank nexus is expanding faster than any other EM region.
Gem Research Perspective
Our central case for EM debt through year-end 2026 is cautiously defensive, with selective opportunities in specific segments that current spread levels do not adequately compensate for. The aggregate EM corporate HY OAS at 269bps — inside the long-run average of 330bps — is pricing a credit environment materially more benign than the sovereign stress map warrants. We expect spread widening of 40–70bps in EM HY corporates over the next two quarters, driven by a combination of Turkey-related contagion risk, Nigeria fiscal deterioration, and the mechanical effect of the 2026 sovereign refinancing calendar on market technical conditions.
The key variable to monitor is not the VIX — currently at 16.3, below the 20 elevated threshold, per FRED — but the US Dollar Broad Index. A sustained move above 122 on the Broad Index would, in our assessment, constitute the trigger level at which EM hard-currency credits with large current account deficits begin to experience systematic spread pressure rather than episodic volatility. Egypt’s IMF programme review in October 2026 and Nigeria’s Q3 2026 federal budget execution data are the two scheduled event risks most likely to produce material price discovery in the segments most under-priced for stress.
Investors positioned in EM IG sovereign names at near-October-2007-tight spread levels should treat current marks as an exit opportunity, not a carry entry. The asymmetry of return relative to tail risk at these levels is unfavorable. The structural case for EM debt over a 3–5 year horizon remains intact; the cyclical case for current spread levels does not.